Technical analysis of “Webmelt” 2 June 1402 / Is the brilliance of Bank Mellat shares continuing? – Tejarat News
According to Tejarat News, Mellat Bank shares are traded in the capital market with a market value of 180 thousand billion in the price range of 502 Tomans. Currently, the P/E of “Webmelet” symbol is 4.13, and the P/E of Banks and Credit Institutions Group is 6.19. This attractive P/E has made Webmelet the focus of attention of investors and capital market people.
Banks and credit institutions industry index from a technical point of view
With the breaking of the control ceiling of the long-term downward trend at the end of January last year, the technical chart of the banking industry index gave a green light to the bullish outlook for this group. In the middle of February last year, after the correction of the market, a good buying opportunity was provided in this group, which resulted in an 85% yield for the shareholders during the three months of February, March and April.
Two technical scenarios of the banking group index
A technical look at the chart of this index shows that the trend of the banking group has returned to its green days before repeating the size of the correction in February. Currently, the banking group index is at the threshold of 580 thousand units, which is its previous ceiling.


In the first scenario, if in the next few working days we see that the banking group index succeeds in crossing and stabilizing above the ceiling of 580 thousand units, then the Hagopian situation is confirmed and targets much higher than the Andrews fork ceiling are available to the capital market banking group. will be placed

But in the pessimistic scenario, due to the existence of a very important MPL (Multi Pivot Line) in the range of 470,000 units and its elasticity according to Andrews rules, we should wait for the middle line of the drawn fork to be touched to end the correction process.
Will the upward trend of the web nation stop?
While the majority of the market is in the correction phase, the symbol “Webmelet” has given its shareholders a return of nearly 30% since May 23. The good fortune of the market shareholders towards Webmelet comes from its good annual report.
Examining the price chart of “Webmelet” in the monthly and weekly time frame clearly reveals the reason for the upward trend of Webmelet in the last seven months.
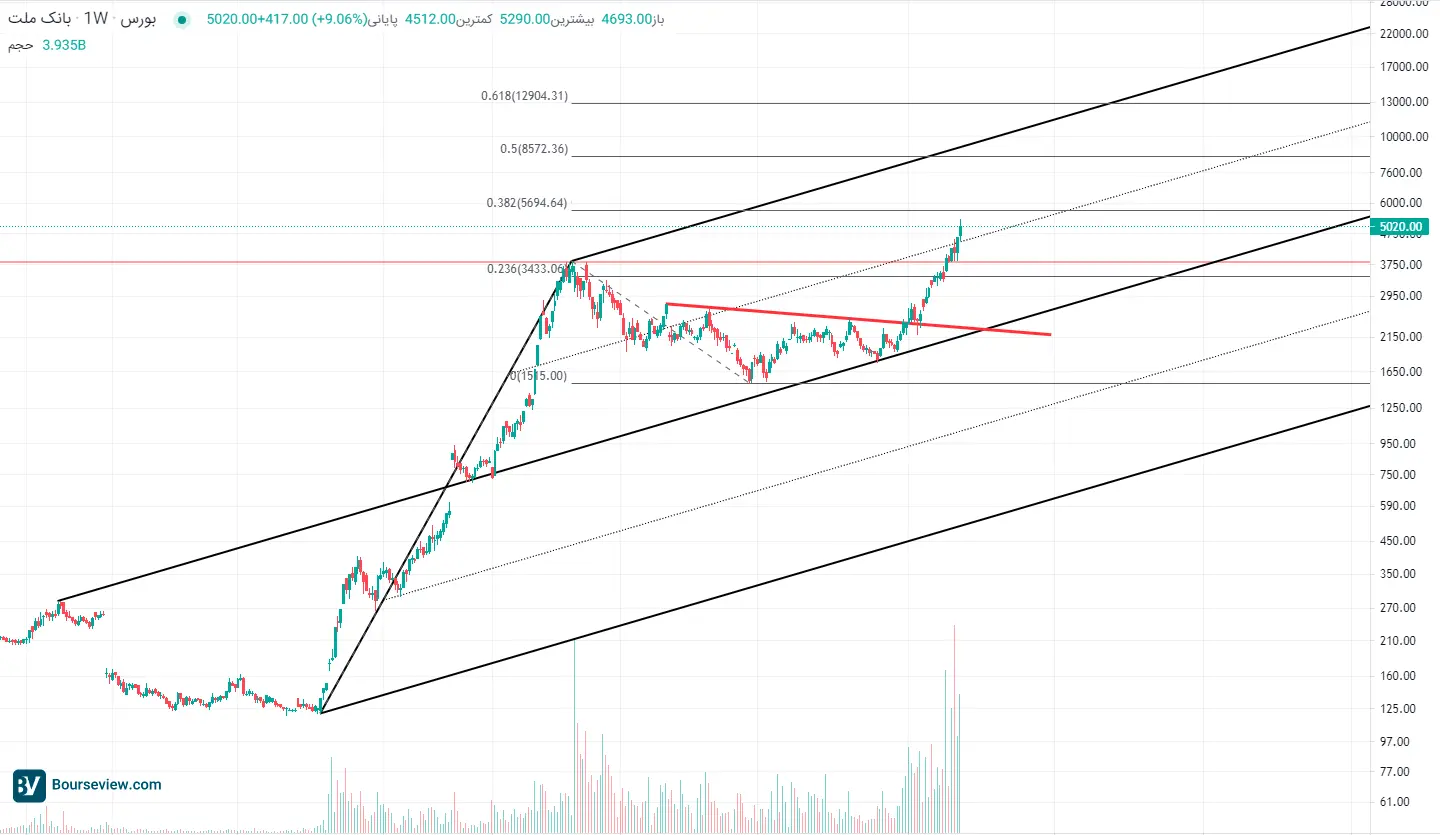
Bank Mellat’s stock price, by repeating the size of the 1995-1997 correction, has started its upward trend as soon as it meets the midline of the Andrews fork. Also, the people of the capital market could enter this bank share in a suitable position by drawing a downward trend line. Since the beginning of November last year, Webmelet has provided nearly 180% return to its shareholders.
The analysis of price behavior in a similar event in the past, shows that after passing through its historical ceiling in 1997, Webmelet returned to it after a while and continued its upward trend in completing its pullback. 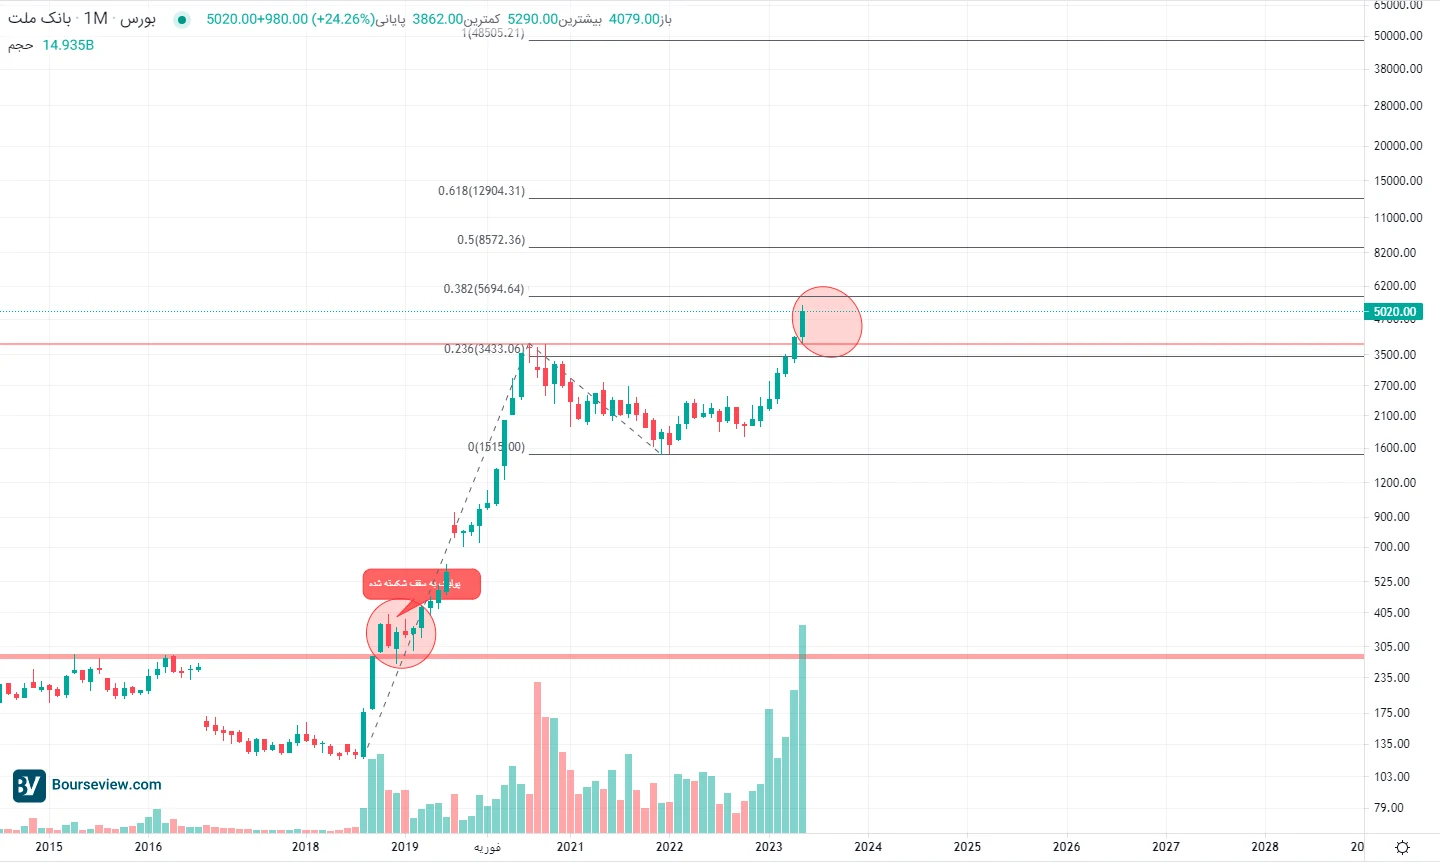
Currently, during the upward trend of the last seven months of the capital market, like the overall index, Webnation has also managed to cross its historical ceiling. If it is based on the repetition of history (the principle that technicalists believe in), we cannot ignore the possibility of a pullback of the price of Webmelet to the historical ceiling in the range of 377 to 385 Tomans.
On the other hand, it should be noted that even if the correction wave happens, it is temporary and the outlook of the Web Nation symbol is very positive in the long term, taking into account technical and fundamental factors such as P/E below 5 units.
Fibonacci retracement levels drawn on the previous up and down waves represent the resistances facing the webmail symbol. Of course, besides that, you should pay special attention to the web nation symbol and changes in the volume and value of transactions.
Divergences become the bane of the nation?
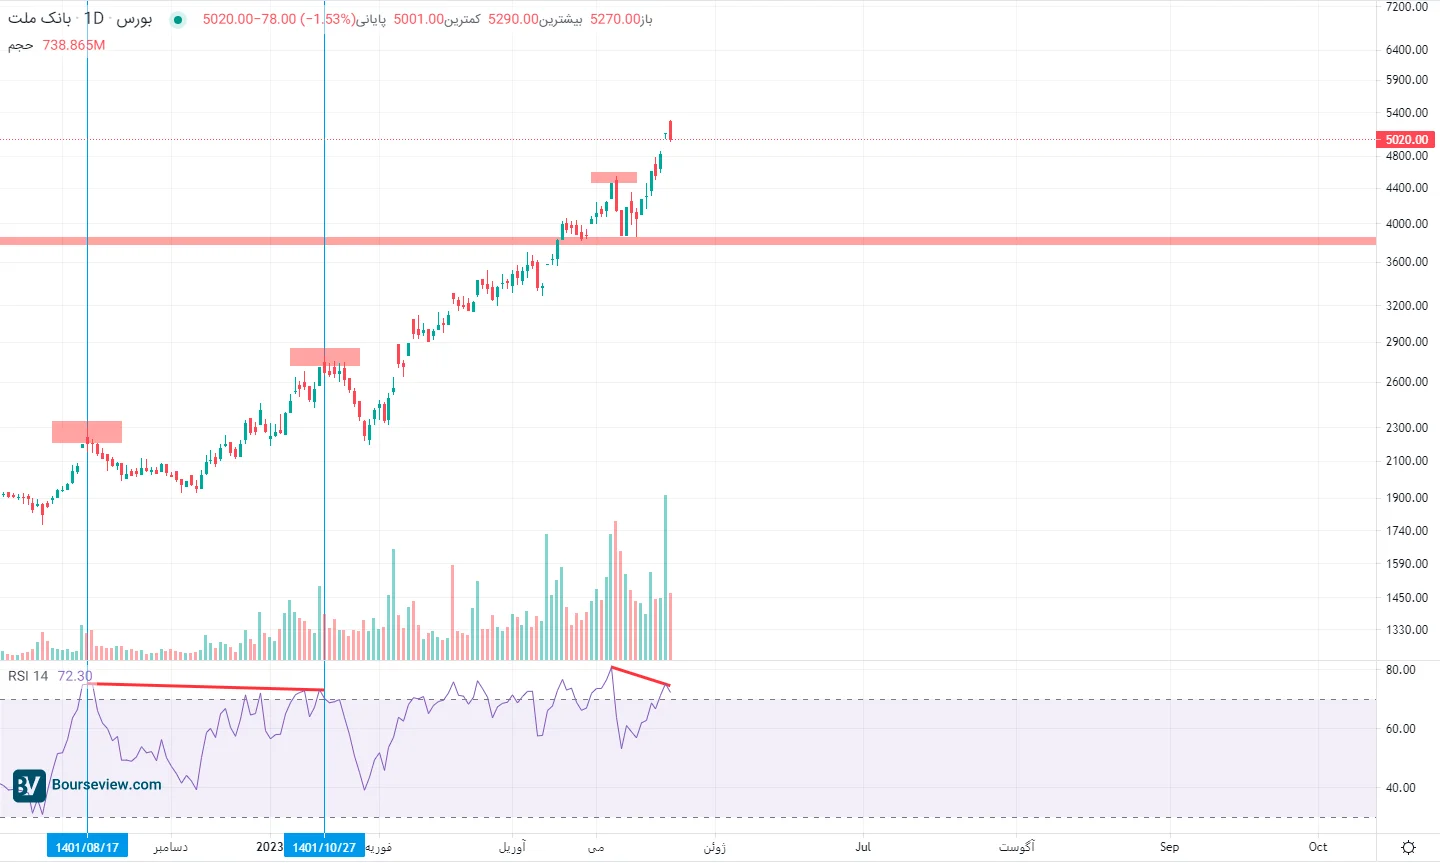
In the daily time frame, two points are noteworthy in the webmail chart. First, the negative divergence that occurred in the RSI indicator. The next important point is the volume of transactions. Yesterday, the trading volume of “Webmelet” symbol was placed in the suspicious volume filter. Also, crossing the previous ceiling in the range of 453 Tomans has not been accompanied by an increase in the volume and value of transactions.
Read more reports on the stock news page.