Technical analysis of Zagros stocks in September 1402 / The wings of Zagros are ready to fly – Tejaratnews
According to Tejarat News, Zagros Petrochemical Company can be traded on the first market of the stock exchange with the symbol “Zagors”. Zagros shares with a market value of 6,762 billion tomans are in the chemical products group.
The analysis of “Zagors” trading board shows that the behavior of the price of this share takes place with a short break in the direction of suspicious legal movements of the share. Therefore, whenever the rights start to buy heavily, a little later, the share of floor swings made in its chart has given good returns to the shareholders. Therefore, in order to recognize the validity of the upward wave, it is very important to examine the legal behavior of the share.
Technical analysis of chemical index
In the weekly dimensions, identifying the major structure in the chemical group index chart helps a lot to identify the trend. After the deep reform of this industry, which occurred simultaneously with the collapse of the market in 1999, a new trend started in the chemical group in the middle of March of the same year. The structures specified in the index chart of this industry indicate that the index of this group is bullish.


Also, the emerging structures show that the corrective waves of the mentioned trend are very similar to each other. So that this index ended during the recent correction of the market from the middle of May of this year as soon as it reached the size of the previous correction, and the indicator of the group of chemical symbols started to make higher ceilings and floors.
The drawing of the Andrews fork tool in the pullback style shows that this indicator measured the level of support of the buyers by testing and then re-testing the middle line, and after that it was thrown upwards. If the last floor is maintained in the range of 152 thousand units, the indicator of the group of chemical symbols has the target of reaching the ceiling of the Andrews fork.
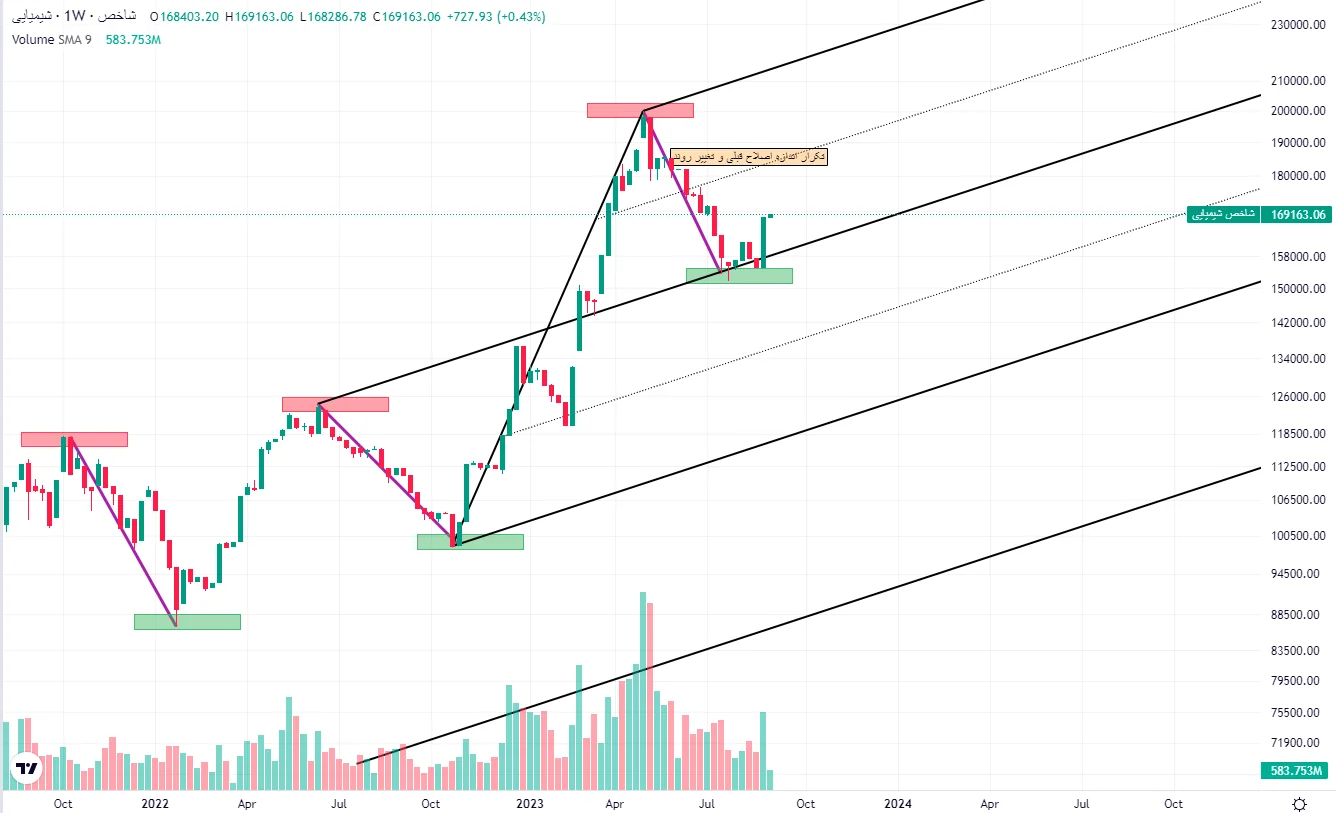
Therefore, it can be claimed that the three previous reform waves are from the same family. On the other hand, the slope of the first wave of this upward trend is very similar to the last upward wave of the market that started in November 1401. Therefore, this point can be used to draw the Andrews fork.
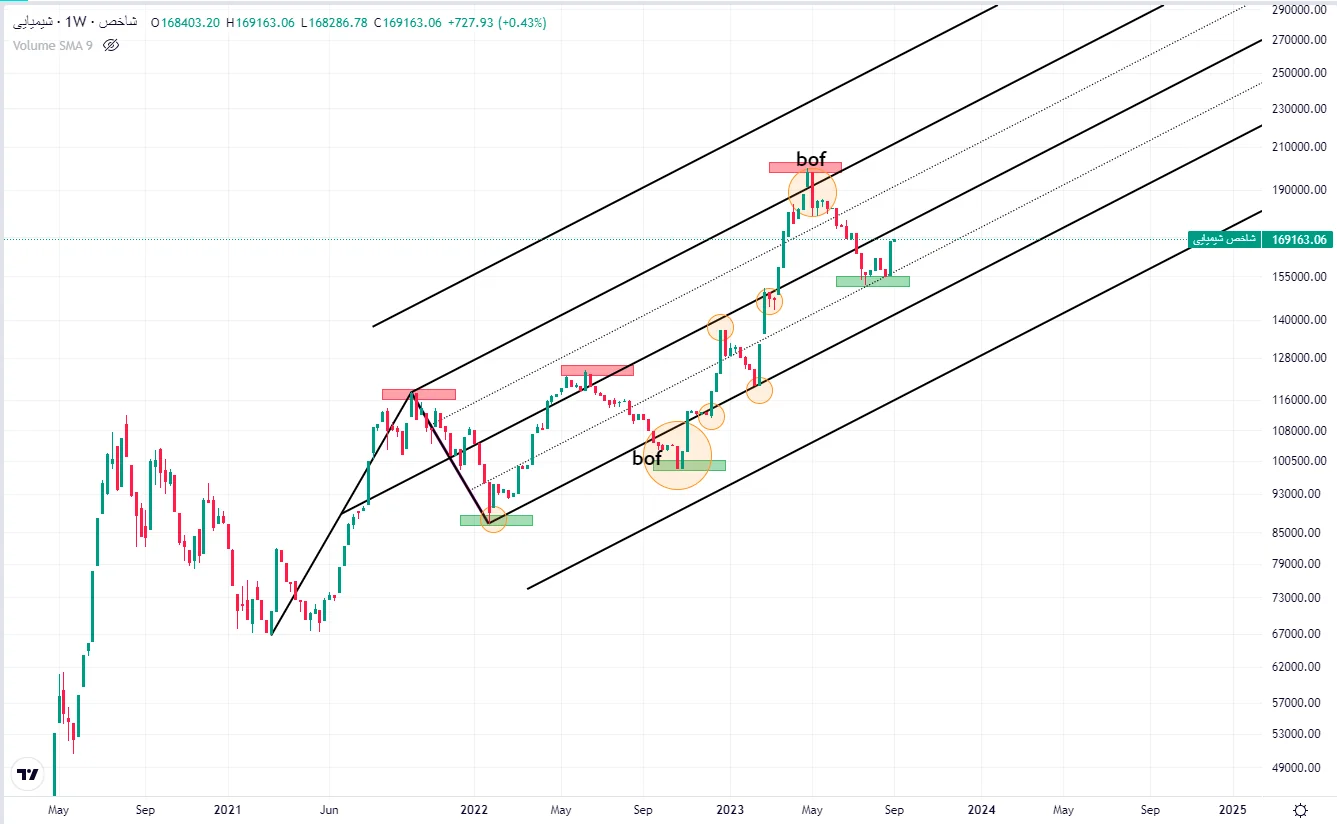
Based on this drawing, if the weekly candle of this indicator closes above the middle line, it has a great chance for the index to grow to a high parallel. This means that the index has crossed its previous ceiling.
Technical analysis of Zagros stocks
In examining the historical chart of the Zagros stock price in the monthly timeframe, we realize a fundamental point. The size of the price drop of Zagros shares from the last week of October 1400 to a year later is very similar to the price drop of this symbol between December 1992 and October 1994.
This point gives a basic approach to wave counting. Based on this, by repeating the correction wave size, the fourth wave has ended and we are in the fifth wave. Therefore, in a long-term perspective, the price has the ability to reach the level of 1.618 percent Fibonacci correction drawn on the third wave of the Zagros stock price chart by maintaining the floor of 8,380 tomans.
By drawing an Andrews Fork PBML (Pull Back Median Line), the recent modification of the Zagros symbol takes on functional logic. This is because the price is trying to provide the necessary energy for the next step by hitting the middle line of the fork again.
A closer look at the Zagros chart
In the daily time frame, however, the Zagros stock price tells a different story. During the recent upward trend of the market, from which the Zagros symbol was not excluded, the price managed to advance to the range of 20 thousand and 95 tomans. This means that the last ceiling of the previous downward trend has been broken at the level of 18,177 and the change of behavior (CIB) signal of the chart has emerged.
Therefore, the current dominant trend is bullish. In this situation, drawing a fork from the last three pivots of the previous trend can provide shareholders with a good road map for predicting the continuation of Zagros stock price movement.
We can see that by converting the purple trend line to the centerline and using the Fibonacci channel tool (corrected levels), the price has advanced as far as the distance from the previous floor to the centerline, and after hitting the upper level of the channel, it has entered the corrective phase. Therefore, breaking the dynamic line of the upper level of the Fibonacci channel can be a good trigger for buying. In this scenario, losing the bottom of 11,870 tomans will cause this analysis to expire.
With this account, the price target of Zagros shares in this analytical perspective is, first of all, the range of 17 thousand 740 to 18 thousand 162 tomans, which is obtained from the intersection of the middle line and the ceiling of the range.
disclaimer: All contents included in this site are research, scientific and news and are not recommended for direct activity in any market.
Read more market analysis reports on the Capital Markets page.