Technical analysis update of iron smelting, 27 February 1401 – Tejaratnews

According to Tejarat News, in continuation of the production of steel products, with the launch of the steelmaking and rolling engineering department in January 1351, the smelting activity actually started with a capacity of 550 thousand tons per year. Finally, Zob Ahan Company of Isfahan was registered in September of 1953.
The main activity of this company includes smelting, casting and rolling of ferrous metals and alloy steels for the production of various standard engineering sections and sheet production.
Zob Ahan Isfahan is the largest steel company in Iran in terms of variety of products, which produces products such as construction and industrial steel sections with a capacity of over 3 million 600 thousand tons.


The shares of this company were offered in Tehran Stock Exchange for the first time in March 2010 at a price of 130 Tomans. Zob is currently traded with a market value of 20,241 billion tomans in the basic metals group.
It should be noted that on February 12, the market value of Zob Company was 19,307 billion. Stating this point shows that in the last two weeks, which includes 8 working days, the market value of Zob has grown significantly and money has entered it.
A review of the previous analysis
In Zob’s technical analysis, which was published by Tejarat News on 12th of February, the support ranges in front of the share were mentioned.
By examining the chart of Zob symbol on the mentioned date, which is clear in the picture, it was stated that by drawing a retracement Fibonacci on the last ascending log of the stock, it is evident that the first support for Zob is the 38.2 level of the corrective Fibonacci tool. This support for Zob is valid because it overlaps with the share’s last bearish ceiling range.
It was also mentioned that the overlap of these two supports, which finally defines the range of 250 to 265 Tomans for the analysts, is considered an important support for the share, and in case of losing this valid range, the 50 and 61.8 percent Fibonacci correction levels are the next bastions for They are the support of Zob, which should be carefully monitored for price behavior in these ranges.
Zob technical analysis update
Examining Zob’s chart now shows that after the price has penetrated the mentioned support range, the strong flow of demand in this range has thrown the share up.
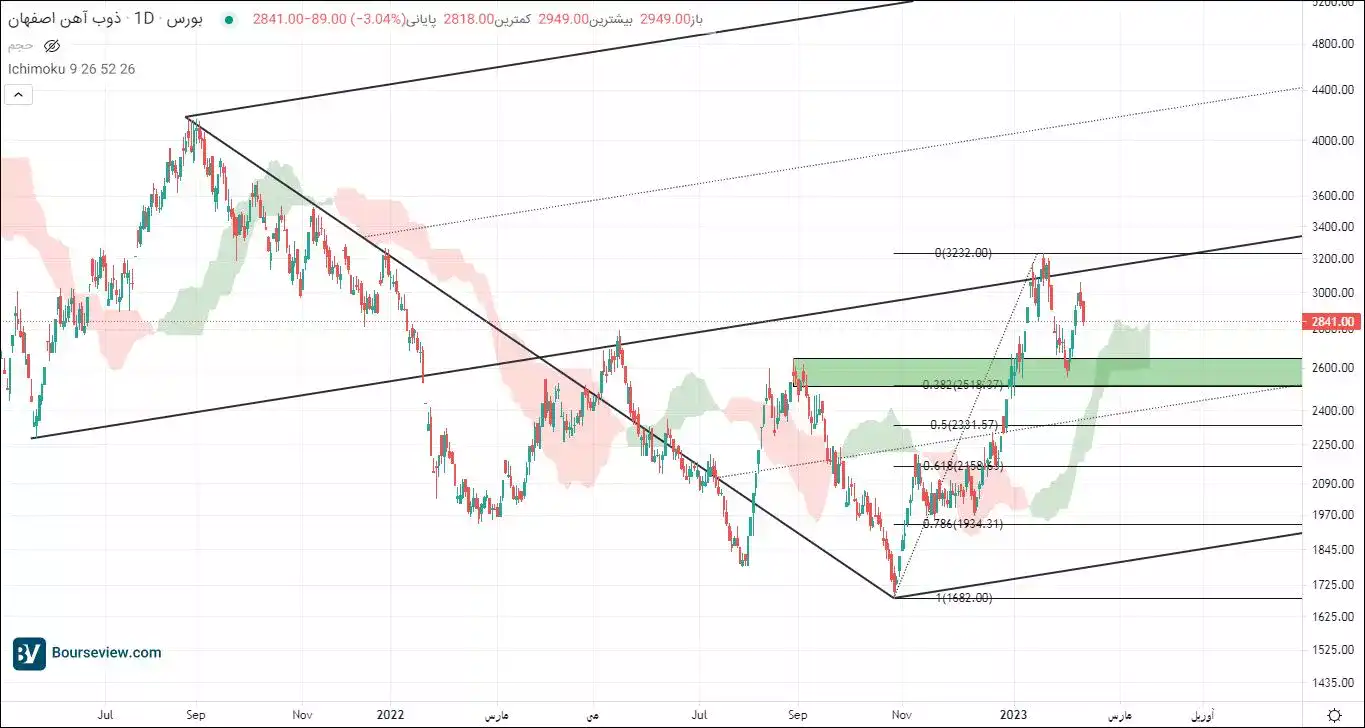
So that in the last two weeks, the lowest price of Zob is 256 Tomans, and on the 17th of Bahman, the symbol of Zob was traded at this price. At the same time, the highest price of 305 Tomans is shown to the shareholders. In terms of percentage, this amount of changes is equivalent to more than 19% growth in Zob’s stock price.
The growth of Zob stock has been achieved while the general index in the last two weeks has generally not been happy and has given negative returns to the shareholders.
At the moment, however, considering that Zob has recorded a price turn, it can be assumed that it has failed to reach the middle line of the Andrews fork, which we examined in detail in the previous analysis.
This incident in Zob’s price chart may lead to further correction of the price, and market participants should wait for the price to hit the support ranges in order to buy shares with a volatile view.
Read more stock market reports here.