The continuation of the upward trend of Bitcoin for the second week in a row; Wait for the trend to change?

Bitcoin is a little more than 24 hours away from registering its second bullish candlestick in a row on the weekly chart, and Ethereum is on the verge of registering its fourth bullish candlestick on the weekly chart. In addition, the “fear and greed” index of digital currencies also shows the improvement of traders’ sentiments in recent days.
To Report CoinDesk, Bitcoin is up 5% so far this week (since Monday) and is on the verge of posting its second straight week of gains in a long time. In addition, these seven days can be the third rising week of the market in the last 4 weeks.
On Thursday, even though the US Department of Commerce announced that the country’s gross domestic product has been declining for the second consecutive period in the past three months, Bitcoin’s upward trend continued. It should be mentioned that according to the technical definitions of the economy, the reduction of GDP in a country for two consecutive periods is considered “recession”.
Bitcoin is currently trading around $23,800 and has lost 1.25% of its value in the last 24 hours. This is despite the fact that in recent hours, the daily yield of Bitcoin has constantly changed from a positive number to a negative number and vice versa. In addition, the yield of Bitcoin since the beginning of 2022 is still around negative 50%.
The 30-day correlation between the price of Bitcoin and major stock indices has increased over the past week, and this is in the context that digital currencies and the global stock market have both been growing during this period.
The “S&P500” stock market index experienced a 1% increase on Friday, and at the same time, the Dow Jones industrial index (Dow Jones) also increased by 0.9%.
Ethereum, which has lost 0.34% of its value in the last 24 hours, has increased in price by 8.36% in the last seven days and is now trading around $1,700.
Market Reversal Signs on Bitcoin Weekly Chart
Charts consisting of one-day candlesticks are usually investors’ default standard for market analysis; But sometimes longer-term views may provide traders with a better view. For example, right now on Bitcoin’s weekly chart it looks like investors are looking at the $20,000 level as a solid entry (buy) point.
Since the week ending April 3 (April 14), Bitcoin has seen 9 consecutive bearish candles and until June 19 (June 29), it has had a bearish performance in 10 of the existing 12 weeks. Meanwhile, the downward movement related to the twelfth week was accompanied by the fall of the relative strength index (RSI) to the level of 19.43 (sold saturation).
The relative strength index is a technical indicator that measures the speed and extent of price changes. It should be mentioned that this index is above the level of 70 oversold and reaching below the level of 30 oversold in the market of a digital currency.
Bitcoin’s RSI index in the weekly view is now at 35, which indicates that the market is neither oversold nor overbought, but in a balanced state.
Compared to the 10% growth of the previous week, the price of Bitcoin has jumped by 5% this week, and Ethereum, similar to Bitcoin, has grown by 8% this week, while it experienced a 19% growth last week. It should be noted that Ethereum is on the verge of registering its fourth consecutive bullish candlestick on the weekly chart, and Bitcoin is not far from closing its second consecutive bullish candlestick.
The 10th experimental fork of the Ethereum network took place last Tuesday, 26 hours earlier than expected, while Ethereum developers are busy conducting numerous tests on the verge of updating the network from the current proof-of-work model to proof-of-stake. As the final Ethereum update approaches in September, the Ethereum network is undergoing a series of tests that simulate the blockchain’s final update by copying mainnet data to a test network environment.
The transition to proof-of-stake is expected to have an anti-inflationary effect on the price of Ethereum and ultimately lead to a decrease in the total supply of this digital currency. It should be noted that a decrease in the supply of an asset usually leads to an increase in the price of that asset.
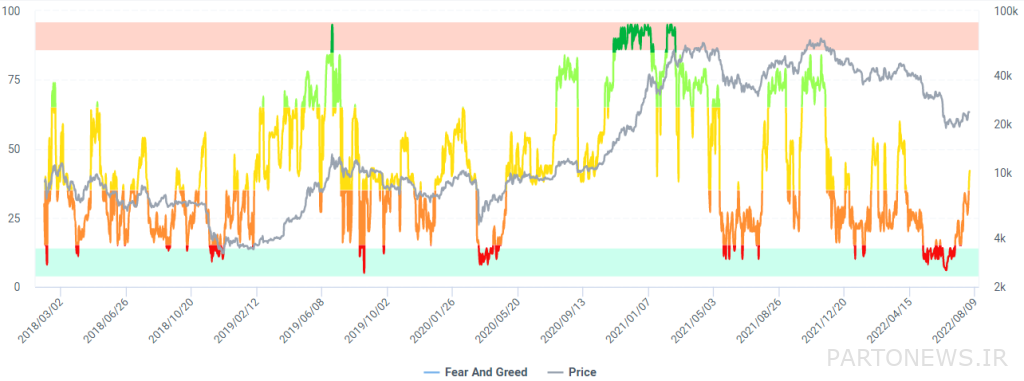
As you probably know, the Bitcoin Fear and Greed Index measures traders’ sentiment toward price changes and scores market sentiment from 0 (extreme fear) to 100 (extreme greed).

This index evaluates a set of information including price, momentum, volatility, sentiments of social network users and Google searches. Although this indicator is designed specifically for Bitcoin, it can be a good tool for measuring the general sentiment of the digital currency market.
Yesterday, this index was at the level of 39, which is still in the range of fear; But it is far away from level 6 (extreme fear) which was recorded on June 18 (June 28). The peak of this index in the last 12 months goes back to recording the level of 84 in October (October 1400); That is, when Bitcoin was traded at a price of more than 60,000 dollars.

