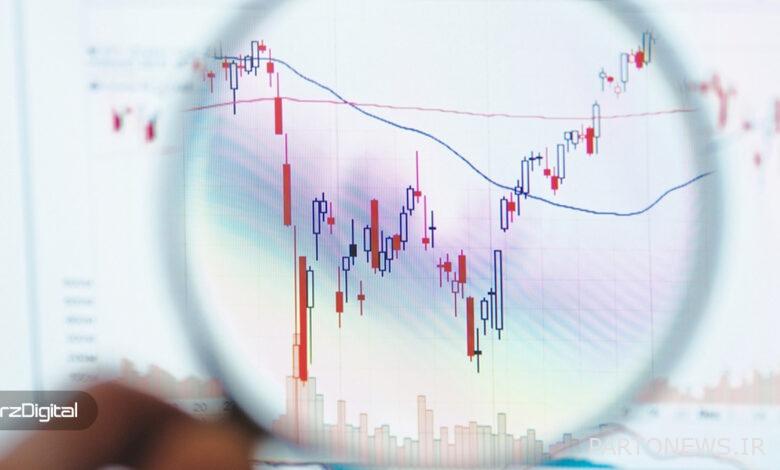
The golden intersection is about to form on the weekly chart of Bitcoin; Should we wait for the price to continue to jump?

A rare technical bullish signal is forming on the weekly chart of Bitcoin, which on the time frame or day view of the market, has mainly been a prelude to the start of an upward move. But is this sign going to end up in favor of price growth this time?
Bitcoin is about to register a golden cross on its weekly chart. This crossover occurs when a medium-term moving average crosses the long-term moving average upwards. The periods commonly used for these moving averages are 50 and 200 for medium and long term respectively. Traders generally expect a sharp rise in price when they see this signal.
Henrique Paiva, analyst at Crypto Select, at interview With CryptoBriefing about the possible formation of this sign on the weekly chart of Bitcoin, he said that the purpose of the golden intersection is to act as more than a trading signal. This indicator depicts the possible trend change and the strength of the price movement.
The analyst distinguishes between a simple and true golden cross, and says that the key difference between a full-fledged golden cross and a simple example of this sign is that both the medium-term and long-term moving averages must move up; The issue seems to be the case with the intersection on the Bitcoin weekly chart, if it forms.
Paiva explains:
Moving averages are known as lagging indicators, and waiting for a crossover to form between them is a way to get confirmation of the start of a new trend in the market.
Since 2011, there have been 10 cases of golden intersection One day timeframe Bitcoin has been recorded, two of which have occurred this year. Both of the 2023 golden intersections have also led to price growth in long-term periods.
Paiva says:
Even knowing that the previous 8 golden intersections do not have a statistically significant relationship with each other, the available information still shows traders’ optimistic view of this indicator. Even without considering Bitcoin’s golden intersections, the digital currency has closed its annual candlestick with a profit in 10 of the last 13 years. This is the Golden Cross as a trading signal [برای بیت کوین] Not critical, but it can still be used as a trend filter for other setups and trading patterns.
It is worth noting that it has been observed many times on the chart of Bitcoin and other assets that after the formation of the golden intersection, the price decreased in a short time instead of increasing, and even after that, the death intersection (the opposite of the golden intersection) was formed. Therefore, there is no guarantee that this signal, even if fully formed, will lead to a price increase in the long term.

