The indicator that predicted the previous bottoms of Bitcoin says that we have not reached the bottom yet

The “MVRV Z-Score” index, which has proven its accuracy in determining the bottoms and peaks of the price of Bitcoin in the past, shows that the price of Bitcoin has not yet reached the bottom, but it is close to it.
To Report Cointelegraph, one of the most accurate on-chain indicators in the market, shows that the price of Bitcoin needs to drop a bit lower first before it can reach its long-term trend bottom.
Data from sources including analytics firm Glassnode show that the MVRV Z-Score has almost (not quite) signaled a bearish trend reversal.
It is only a short time before the MVRV index reaches the bottom of its long-term trend
Many traders and experts are debating whether or not the price of Bitcoin may break below its current long-term floor of $17,600. Their other question is when is this going to happen. Now, new data suggests that Bitcoin could easily fall further.
According to Filbfilb, one of the founders of the Decentrader trading suite, the MVRV Z-Score is now around its classic green zone (historical bottom). However, this indicator has not yet reached the point that has indicated the price floor of Bitcoin in the past.
It should be noted that the MVRV Z-Score index measures whether the current price of Bitcoin is high or low compared to its “fair value”.
Using market capitalization, realized Bitcoin price data and standard deviation, this indicator has created one of the most efficient tools available for predicting the bottom and the ceiling of this digital currency.
LookIntoBitcoin’s platform reviews also show that the MVRV Z-Score index has always been able to predict the bottoms and tops of Bitcoin with a time accuracy of two weeks.
The said index has gone below its green zone only a few times. This happened last time in March 2020 (Esfand 98); But if the price pressure continues to increase, we may see such a movement again.
The floor of 16,000 dollars has attracted the attention of traders
Many experts have predicted that Bitcoin’s bottom is in the $15,600 range.
CryptoBullet, a cryptocurrency analyst on Twitter, told his followers that this area is one of several important supports for Bitcoin and traders should keep an eye on it.
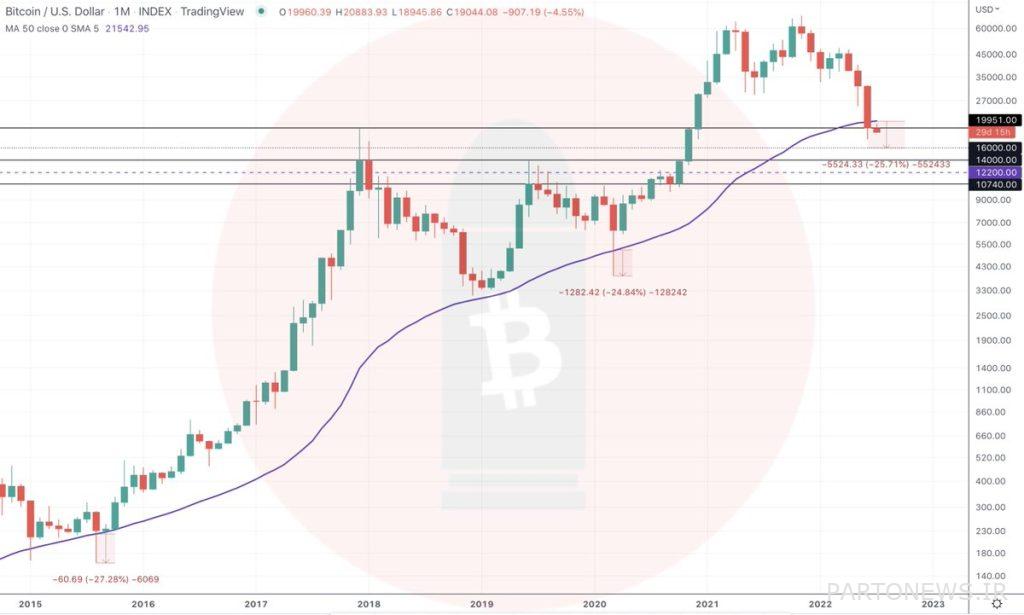
It should be noted that the area of $16,000 is the average deviation from the 50-month moving average of Bitcoin.
Cryptobolt has said about this by publishing the following chart:
Some very important Bitcoin levels:
$16,000: Average deviation from the 50-month moving average (minus 25%).
$14,000: 2019 price peak.
$12,200: The level at which Celsius will liquidate.
$10,700: An important horizontal level.

The Relative Strength Index (RSI) of Bitcoin is also currently at its lowest level. This suggests that the Bitcoin market is in oversold territory and below its previous halving cycle high, near $20,000.

