The possibility of Ethereum falling to $400; Analysts: Upgrading to proof-of-stake could change everything

A key indicator in Ethereum price analysis shows that the downward trend of this altcoin may continue until the level of $400. However, analysts think the trend will be bullish if the update to the proof of stake is implemented.
To Report Cointelegraph In bear markets like today’s, there isn’t much time for the trend-weary to rest. The fear and greed index of the digital currency market shows that investors are in a state of “extreme fear” for the 70th day in a row.
As the market looks for a trigger to reverse its trend, other than Ethereum’s merger (changing the network mechanism to proof-of-stake), there isn’t much that could spark an uptrend. If this is really the case, the market of this digital currency will continue its neutral or downward trend until the possible date of Ethereum integration on September 19 (28 September).
The price of Ethereum is in the channel that it has been trading in since June 13 (June 23) and is currently close to the resistance of $1,240.
Considering that there are a few more months left until the implementation of the merger and other events are going to happen for Ethereum in the short term, we will examine the opinion of some analysts about the future price of this digital currency.
Ethereum price is currently above the moving averages
Peter Brandt, a veteran trader of the financial markets, has released a short message about the current and significant resistance of Ethereum and expressed his hope that the price will break the resistances in front of him.
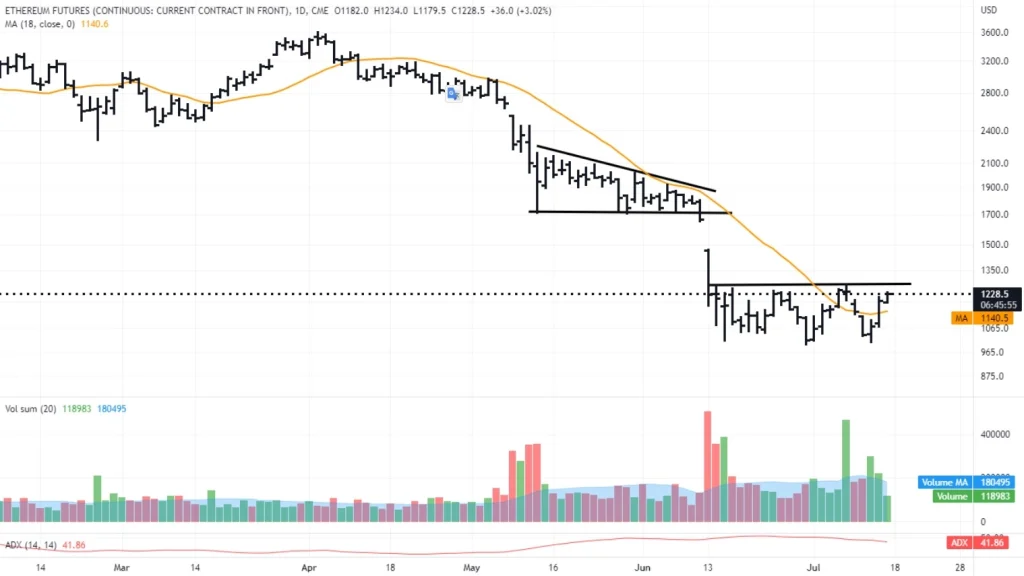
Another anonymous trader, Albert III, said he agreed with Brent’s opinion. By releasing the chart below, he has shown that Ethereum is currently trading above several of its key moving averages.
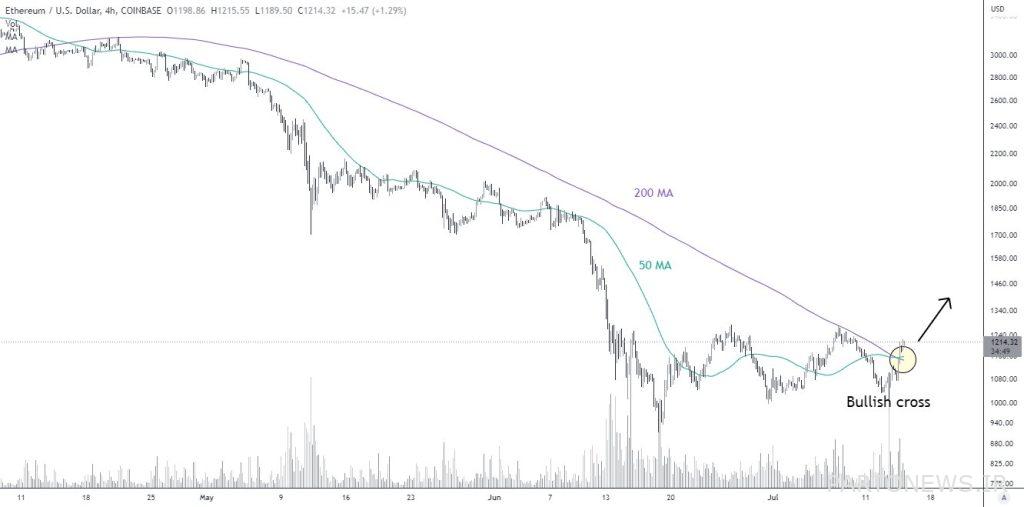
This analyst said:
In the 4-hour Ethereum chart, we see that the 200 and 50 candlestick moving averages have crossed each other, which is a sign of a bearish trend. I look forward to further growth of this digital currency in this area.
Ethereum integration is amazing
The research company Jarvis Labs in its recent report called “30-day return of Ethereum” has tried to measure its short-term profit and loss in the entire digital currency market at a specific time using the 30-day return index of Ethereum.
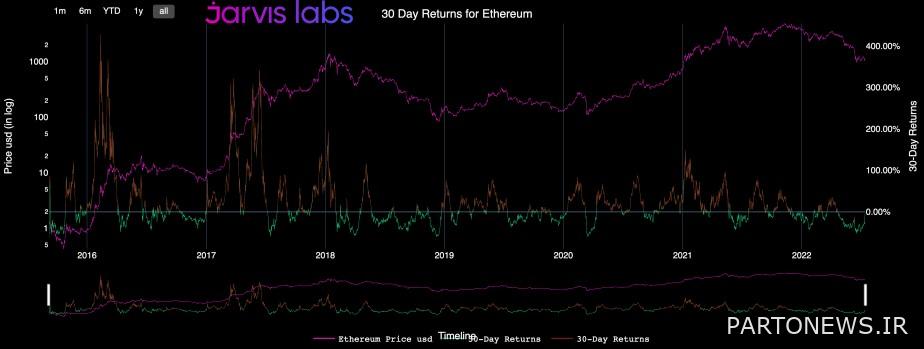
As shown in the chart above, Ethereum’s 30-day return has been negative since April and is now heading towards 0%. This shows that the closer we get to consolidation, the more bullish the market trend becomes.
According to Jarvis Labs, when the 30-day yield falls below zero percent in bullish markets, it indicates a “buying opportunity” and when it crosses above zero percent in bearish markets, it indicates “ideal sales opportunities.”
In the fourth quarter of 2018, after fluctuating near the bottom of $200, Ethereum price dropped to $82 in December of that year. Now the repetition of this price fractal can bring Ethereum to the range of $400 by December 2022 (Azer 1401).
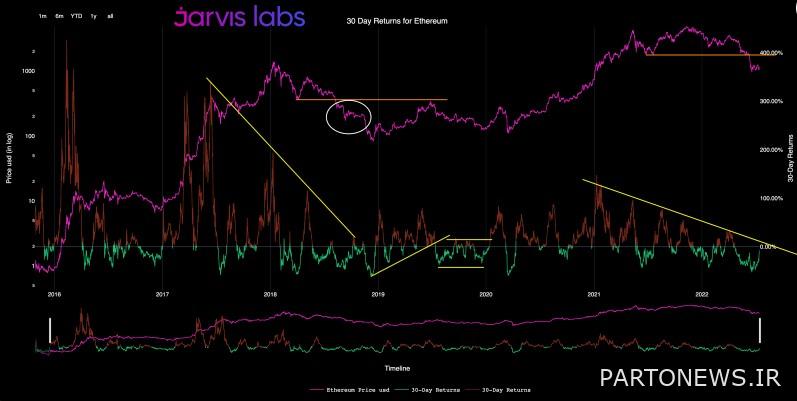
According to Jarvis Labs, if this is indeed to happen again, “any rally to $1,700 for the next year will continue to face selling pressure.”
The company said:
Conversely, the transformation of the $1,700 resistance into a new support is what happened to the $350 level in the summer of 2020 and could signal the start of an entirely new uptrend.
Finally, Jarvis Labs warned that although Ethereum may rise to the $1,400-$1,700 range in the short term, traders should remain cautious; Because they are likely to face strong sales pressure.
Traders are eyeing the $1,420 selling zone
An anonymous analyst named Crypto Tony has reviewed Ethereum’s short-term outlook. Referring to the chart below, he showed Ethereum’s next resistance for traders to watch out for.
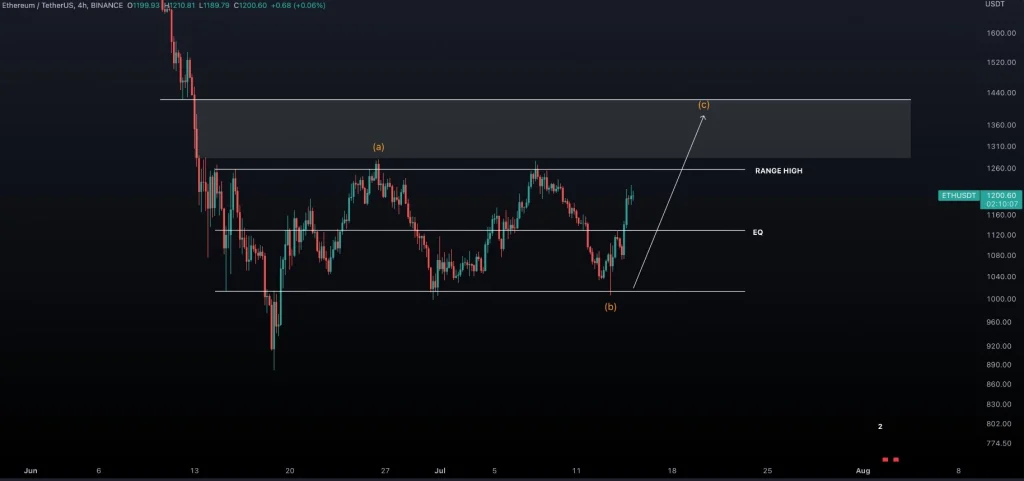
He said about this:
I am looking for the gap above to be filled and we reach the next supply (sell) zone, which is $1,420.

