Was the bitcoin crossing $ 45,000 a temporary leap? Analysts respond

Last week, Bitcoin jumped to a halt on Friday after hitting $ 45,000; But is the move a temporary leap, like the recent fluctuations, or is the market trend set to continue to change?
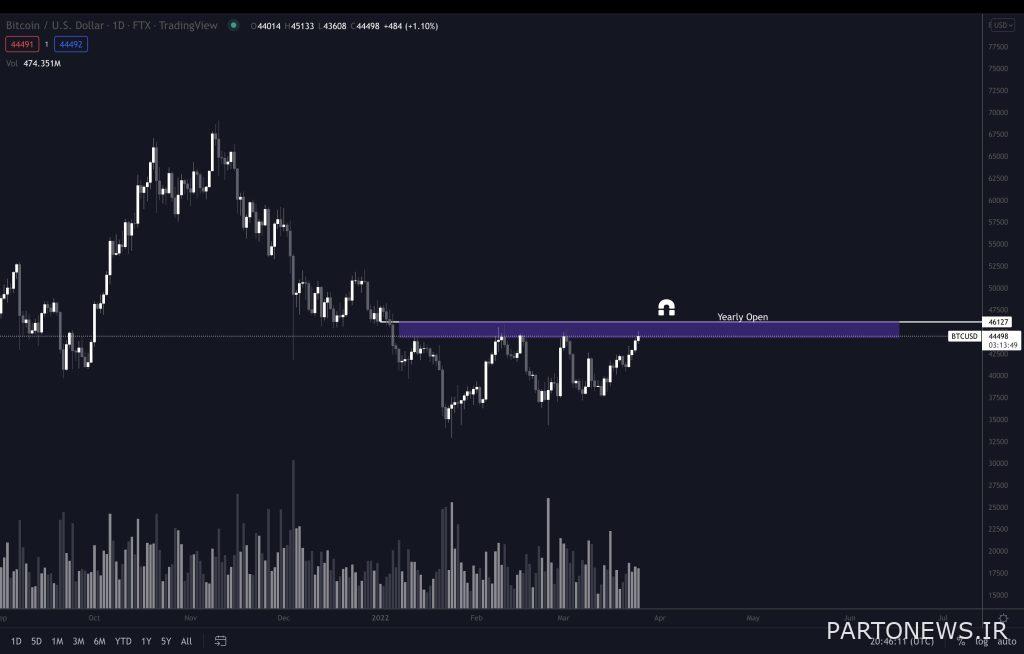
To Report The Kevin Telegraph yesterday slightly corrected its jump after Bitcoin reached its forecast resistance at the starting price of 2022.
Bitcoin traded around $ 44,500 on Saturday and maintained much of its jump over the past week.
On Friday, a relatively strong selling pressure was created in the market of this digital currency and the alarm of its possible correction was sounded. This selling pressure later overwhelmed the market and stopped the growth of Bitcoin at the level of $ 45,000.
Pentoshi, a popular digital currency trader, said:
We are still waiting to see how Bitcoin moves around its initial price in 2022. The last time the price reached this resistance area, it failed to cross it; Although he was not far from crossing it. This time, however, Bitcoin is in a better position, and it can almost be said that it has achieved this goal.

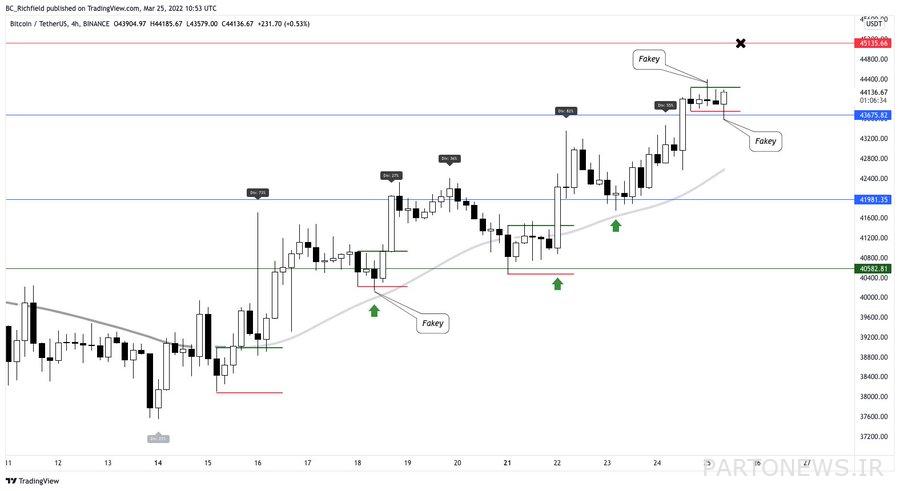
Meanwhile, a Twitter user named BC Richfield stressed that Bitcoin should break its current high of $ 45,135. According to him, this digital currency in its four-hour chart has hit this range twice so far and has not been able to cross it. In his opinion, if Bitcoin fails to do so, it will be in a bad situation.
He wrote on Twitter:
In the four-hour Bitcoin price chart, the latest candlesticks have caused two mock failures outside the range of the Inside Bar pattern, and as you can see, neither has been successful. I think Bitcoin can reach this resistance again at $ 45,135 before a significant jump or deeper correction. If Bitcoin makes an unrealistic failure for the third time within the range of the Kendall Inside Bar pattern, it may fall; Something that is certainly not far from the mind.
It should be noted that this pattern usually indicates skepticism among traders and is formed before a significant uptrend or downtrend.

Another topic of discussion last week was that the blockchain development team of Terra once again bought the equivalent of billions of dollars worth of bitcoins. The protocol executives have deposited approximately 3,000 more bitcoins in their wallets, which means that with this new amount, they have 24,954 bitcoins equivalent to $ 1.1 billion.
Last week, media attention to the news gradually increased. Analytical firm Messari emphasizes that “increasing the use and improvement of fundamental factors” associated with the China Terra block, the price of LUNA, the main token of the network has increased and the price of other tokens based on smart contract networks has decreased .
At the time of writing, however, the price of Luna is down 3.8 percent from last week, while the price of Bitcoin and Atrium is up more than 6 percent over the same period.
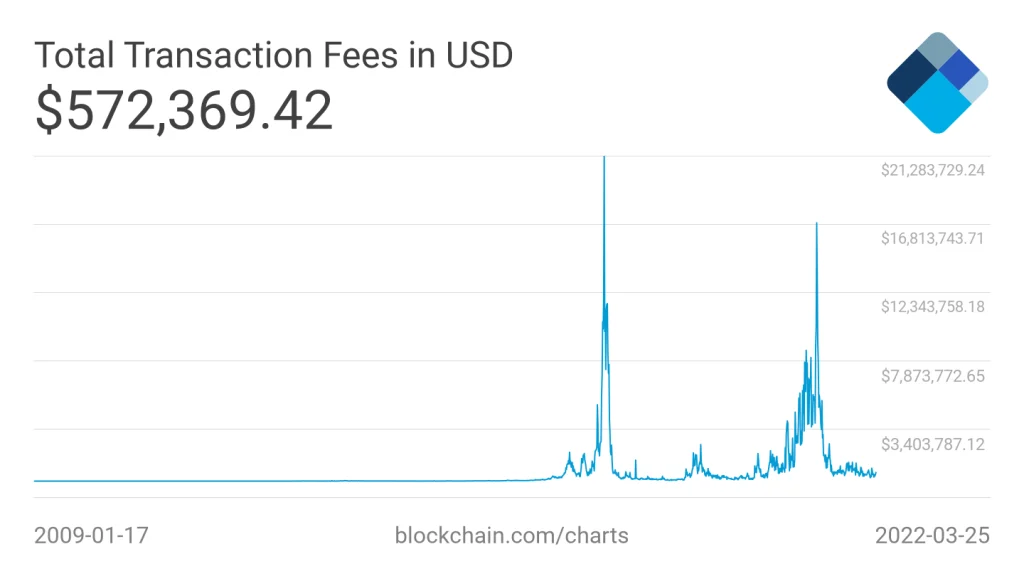
Bitcoin network transaction fees are still low
The digital currency community is as focused on change as ever; But ordinary people are also secretly monitoring and following bitcoin.
In addition to Google Trends data from Internet users’ searches, which shows that the market trend has remained slow and digital currencies are not very popular, Benjamin Cowen, a well-known digital currency analyst, says that low commissions on bitcoin transactions show activity. In the network this is digital currency.
He said:
To some extent, the bitcoin transaction fee shows traders something about this digital currency. It is now clear that short-term traders are out of the market; But they will definitely return to this market. They always do.


