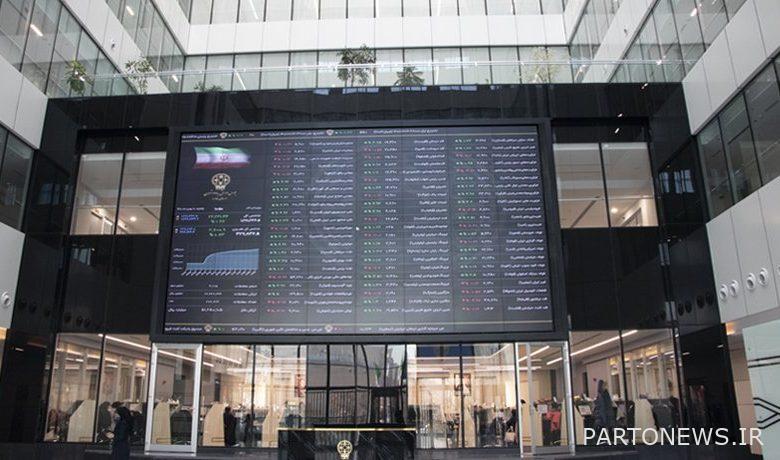
Weekly stock market trend analysis / total index crossing the 20-month ceiling!

According to Trade News, the total index Exchange On Wednesday of the last week, it reached the level of 1,594,000 units from the range of 1,564,000 units and recorded a growth of 1.9 percent.
The homogeneous index was also upward and grew by 0.14% to the range of 442,623 units. The OTC index also stood at 21,643 units and experienced an increase of 0.73%.
The important point is that the total stock index reached its third target on Tuesday, the resistance of 1.6 million units. This is the highest level of the total stock market index since October 26, 1999. But the break did not last long, and on Wednesday the overall index fell again.
In the past week, the average value of transactions was more than 7,000 billion tomans, which is a record in its kind. Because the value of transactions until last week was in the range of 6,000 billion tomans.
How much liquidity went out of stock?
In the fourth working week of May, real shareholders withdrew a total of 460 billion tomans of their liquidity from the market.
The average trading volume of the week was about 13 billion shares and the per capita sales this week were in the range of 20 million tomans.
In the past week, most of the stock exchange industries have turned positive and negative one day, and there was a kind of liquidity circulating in the glass hall. With this in mind, a bright future can be drawn in the stock market outlook.

