Weekly technical analysis of digital currency prices; How long will the fall continue?

Currently, Bitcoin and many other market coins have lost their key support. As it turns out, digital currencies follow the stock market, which has also fallen. One reason for the decline is that many investors have reduced their investment in risky assets for fear of a faster rise in bank interest rates in the United States.
Arthur Hayes, former CEO of BitMEX Digital Currency Exchange, has said that the stock market may stagnate as interest rates rise and the US Federal Reserve’s balance sheet falls. If that happens, Hayes says, the digital currency market is likely to continue to plummet, with Bitcoin and Atrium priced at $ 30,000 and $ 2,500, respectively.
Cathie Wood, founder of Ark Invest, has said that decentralized finance programs have attracted a lot of investors during this time, and that the traditional banking sector is feeling the pinch; Because in addition to losing the lending and savings market, they will also lose the talent that enters the digital currency space.
While the long-term trend in the digital currency market remains promising, will the situation of bitcoins and bitcoins deteriorate in the short term? To answer this question, we will examine the status of 10 selected digital currencies in the market.
Bitcoin (BTC)
Bitcoin buyers kept the price of this digital currency above the simple 50-day moving average (SMA 50 – red line in the picture) at $ 41.980 for a few days; But they failed to break the 20-day moving average (EMA 20 – blue line in the picture) at $ 43,576, and it can be concluded that the selling pressure will increase as the price rises.
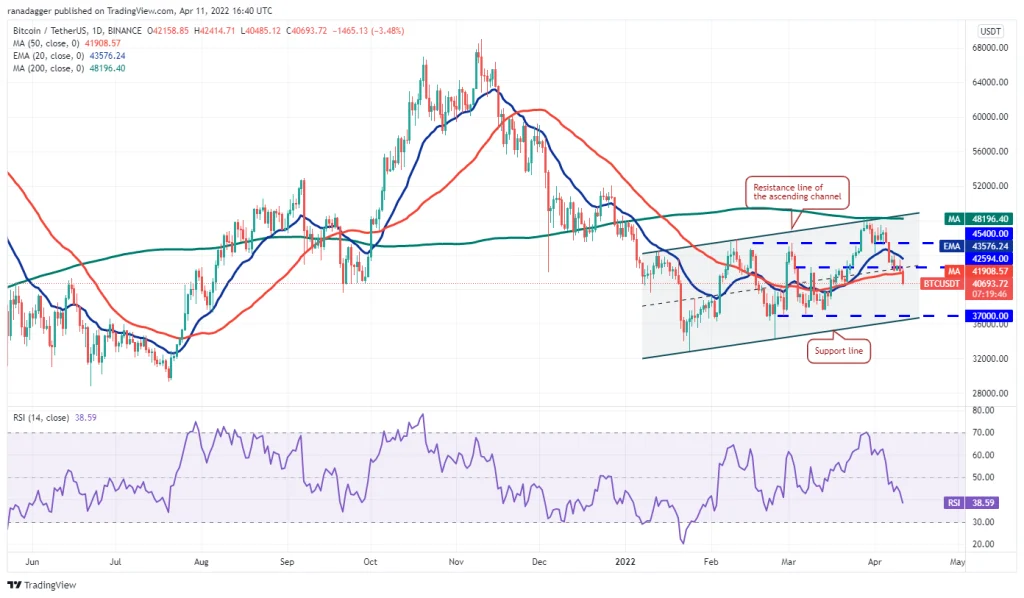
The price accelerated yesterday and this morning and bitcoin fell below the level of the simple 50-day moving average, further breaking the $ 40,000 psychological support. The price is now back above the $ 40,000 level; But it is still possible for bitcoin to fall to the bottom of the bullish channel support. Buyers should also defend the floor support of this channel with all their might.
The 20-day moving average downtrend and the relative strength index (RSI) are in the negative area, which means that sellers are once again taking control of the market. Crossing the 20-day moving average resistance could dispel this bearish outlook, after which we can expect Bitcoin to return to $ 45,400.
- Resistances: 45 ٬ 400
- Sponsorships: 40,000
Atrium (ETH)
Atrium prices fluctuated for a few days, slightly short of the 20-day moving average ($ 3.198), indicating that buyer support was insufficient. This may have encouraged sellers to increase sales pressure even more.
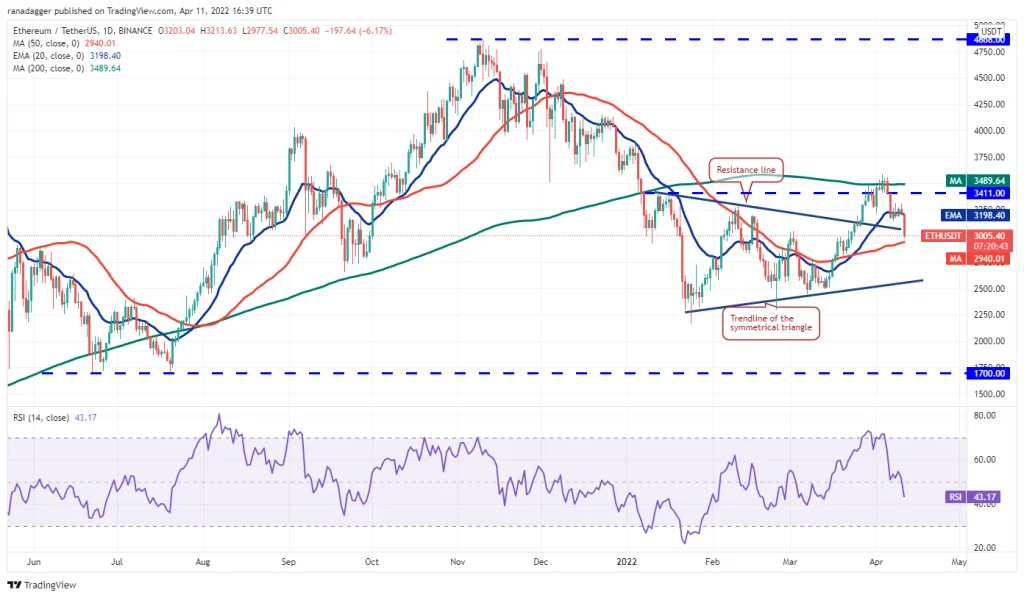
Sellers are now trying to bring the price to the level of the 50-day moving average at $ 2,940, and if the price returns to the upside after meeting this support, it will probably be somewhere between the 50- and 200-day moving average for a few more days (SMA 200 – The green line in the image) will fluctuate.
On the other hand, falling below the simple 50-day moving average could be accompanied by intensifying selling pressure and lowering Atrium prices to $ 2,800. After that, the uptrend line on the chart will act as a key support for the price and buyers are expected to defend it strongly.
- Resistances: 3.489
- Supports: 2,940 – 2,800
Bainance Coin (BNB)
The price of Binance Quinn fell to a few days ago after hitting the resistance of $ 445 and then fell below the 20-day moving average ($ 422 level), which is a sign of intensifying selling pressure after the recent price peak.
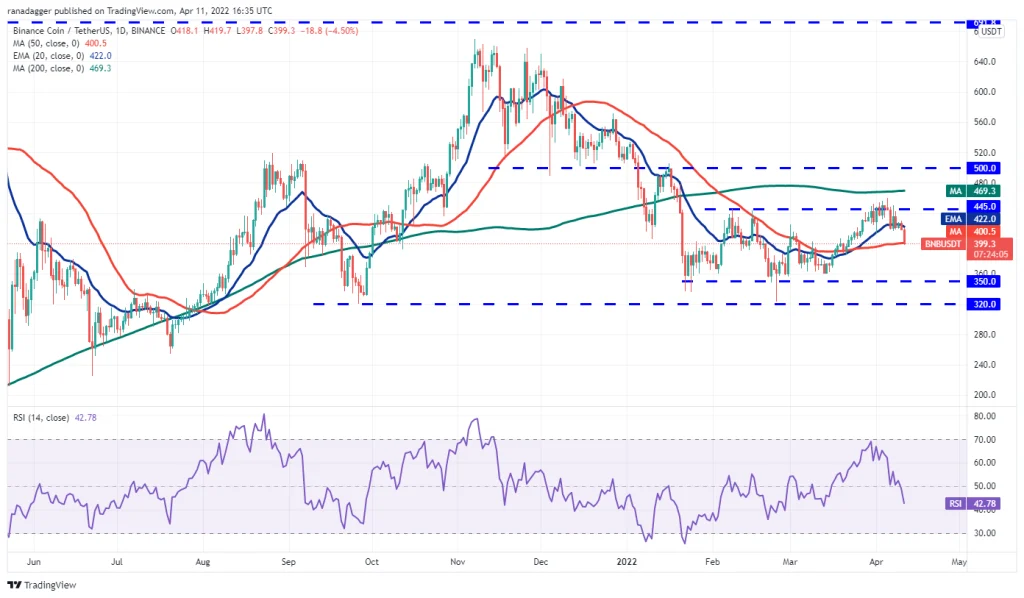
Over the past two days, buyers have been trying to push the price back above the 20-day moving average, but have not been able to do so. This extended traders’ sell-off in the Baines Coin market, dropping the price today to the level of a simple 50-day moving average at $ 400.
A strong price return from this level could mean that buyers are becoming more active in the price floor. In order to get the price close to $ 445 again, they must first overcome the resistance of the 20-day moving average.
On the other hand, falling below the simple 50-day moving average means that buyer support for BinanceQueen has waned. After that, the price may go down to $ 350.
- Resistance: 445
- Supports: 400-350
Solana (SOL)
The price of Solana fell below the 20-day moving average at $ 112 a few days ago after hitting $ 122 resistance. On April 10, buyers once again took Solana to the top of the area; But they failed to reach higher levels. This shows that sellers are becoming more active at price peaks.
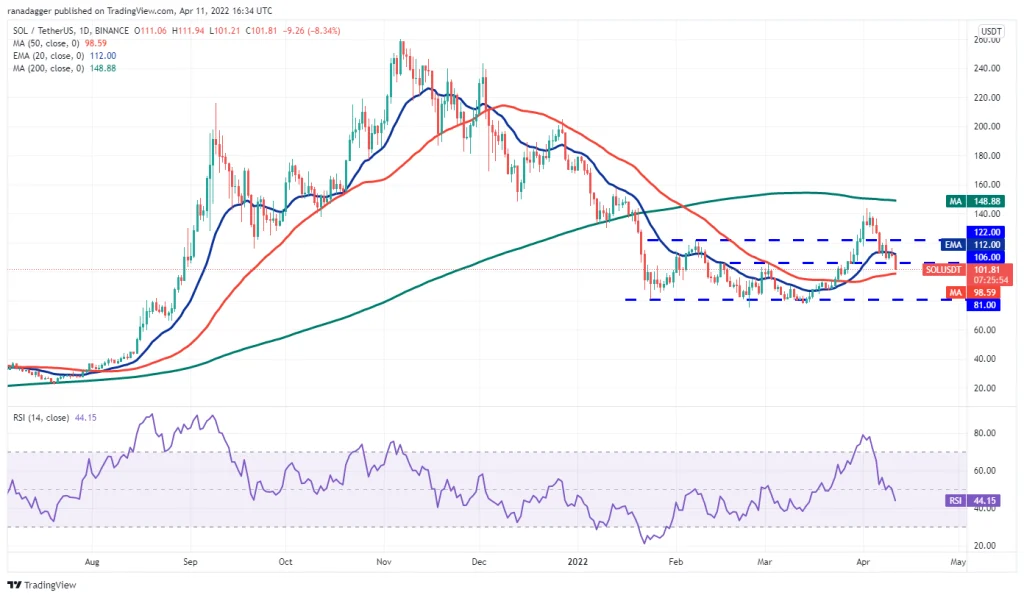
The selling pressure in Solana market intensified yesterday and the price continued to fall below $ 106 support and this morning to $ 98 (50-day moving average). Currently, the price has just recovered from the $ 98 level and reached above $ 103. If this uptrend is not temporary and the price crosses the resistance of the 20-day moving average, it means an increase in the buying pressure on the price floor.
On the other hand, the loss of support for the simple 50-day moving average could pave the way for a reduction in the price of Solana to $ 81.
- Resistances: 106 – 122
- Supports: 98-81
Ripple (XRP)
Ripple prices have been hovering above $ 0.75 for the past few days, and the inability of the price to cross moving averages may now intensify sales pressure in the market.
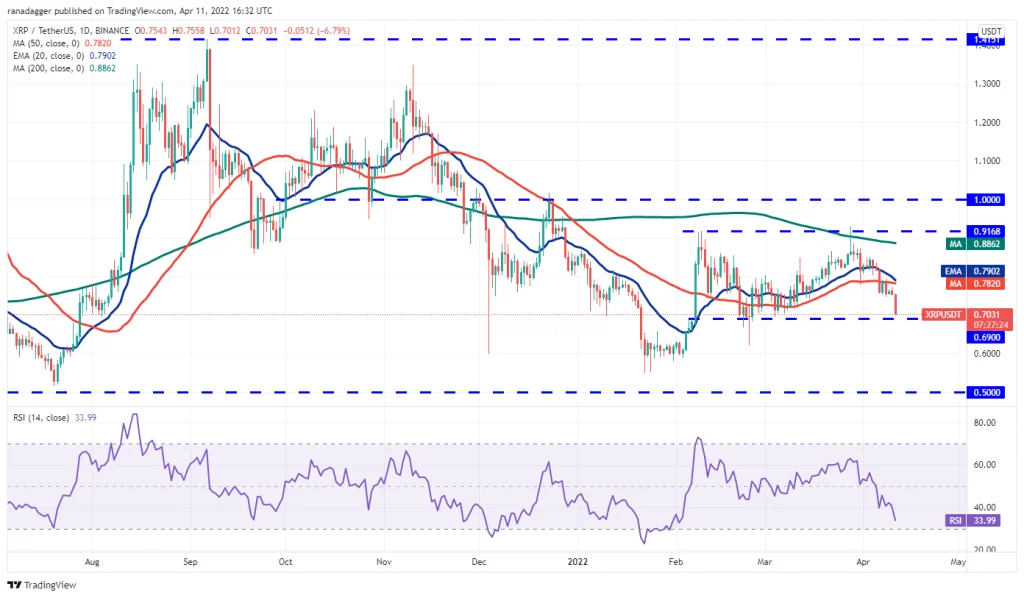
The slope of the 20-day moving average is bearish and the relative strength index is in the negative area, which means that the market is controlled by sellers. Ripple’s next support could be the level of $ 0.69, after which the price fell for a while today and returned to the top. A strong price return from this level could be a sign of buyer support in the price floor, after which the price will probably fluctuate between $ 0.69 and $ 0.91 for a few more days.
On the other hand, the loss of $ 0.69 support could be accompanied by the intensification of sales pressure and the fall of Ripple to the key support of $ 0.60.
- Resistance: 0.91
- Supports: 0.75 – 0.69 – 0.60
Cardano (ADA)
Cardano has repeatedly tried to push above the 20-day moving average at $ 1.06 in recent days; But the sellers did not allow them to do so. Sales pressure has intensified since yesterday, with retailers pushing the price below the 50-day moving average at $ 0.96.
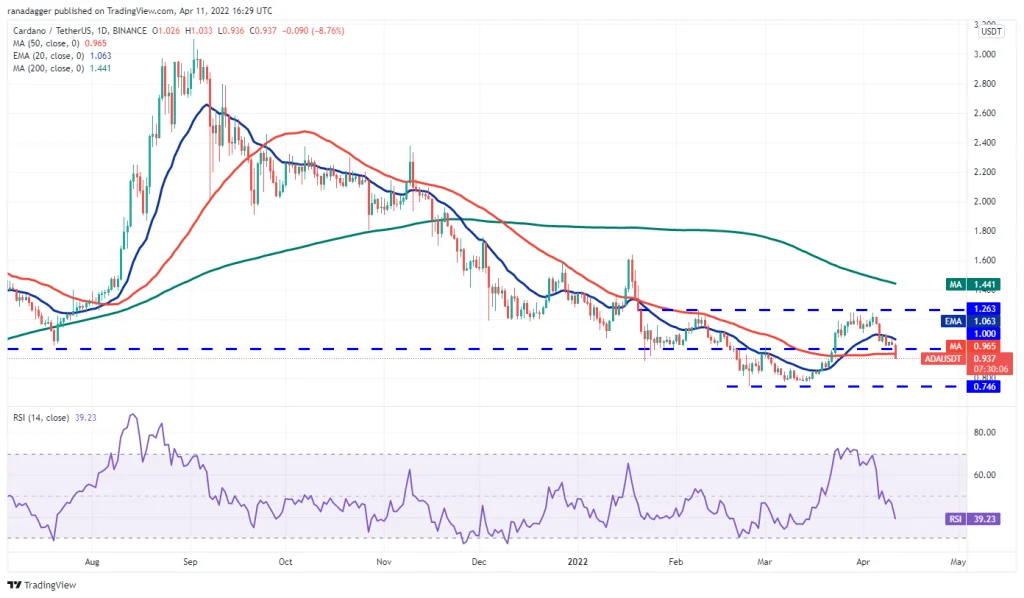
If the price stays below the simple 50-day moving average, it is likely that Cardano will fall to $ 0.74. Buyers must defend this level with all their might. A strong price return after a collision could keep Cardano between $ 0.74 and $ 1.26 for a few more days.
On the other hand, if the price can overcome the resistance of the 20-day moving average, it means that buyers’ activity will increase in the price floor. This could push the price into a new volatile range between the 50-day moving average and $ 1.26.
- Resistances: 1.06 – 1.26
- Supports: 0.74
Luna (LUNA)
Terra Network Luna, the main price token, closed below the 20-day moving average ($ 99 level) on April 8, and crossed it a day later as buyers struggled to regain that level. Appeared unsuccessful. This may have exacerbated market pressure and pushed prices below the simple 50-day moving average at $ 90.
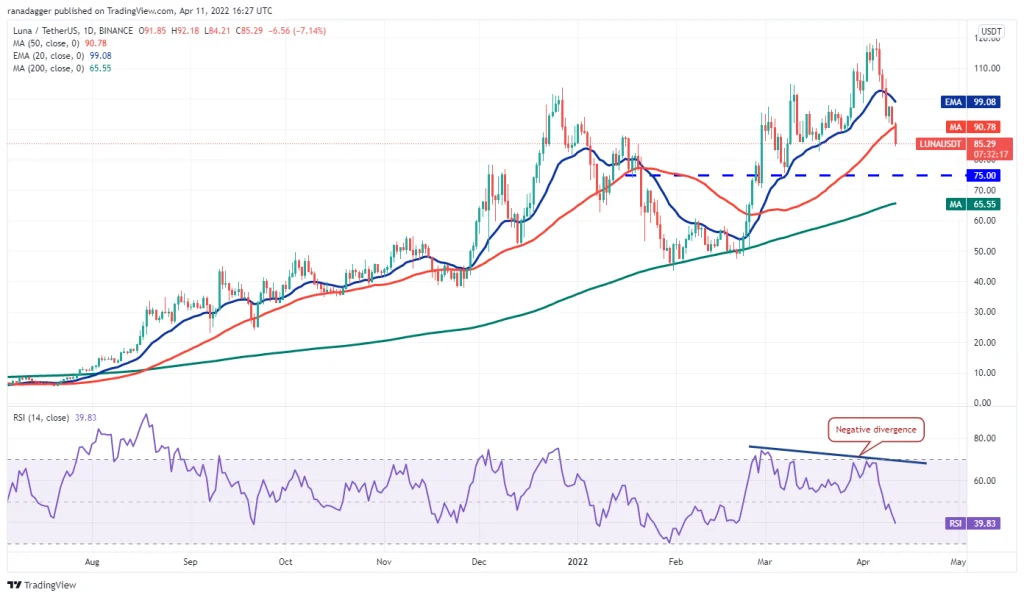
The downward slope of the 20-day moving average and the relative strength of the relative strength index means that the market trend has changed in favor of sellers. If the price stays below the simple 50-day average, it is more likely to fall to $ 75. If the $ 75 support is broken, the simple 200-day moving average ($ 65 level) will act as the next price support.
In contrast, the return of the price above the simple 50-day moving average indicates the support of buyers in the price floors, after which crossing the 20-day moving average will be Luna’s next goal.
- Resistances: 90-99
- Supports: 75-65
Ulnch (AVAX)
Olench buyers failed a few days ago to break the resistance of the 20-day moving average ($ 86), which means that the sellers have been active in this area. This continued with the increase in selling pressure and the deeper fall of the price below the simple 50-day moving average ($ 82) on April 10 (April 21).
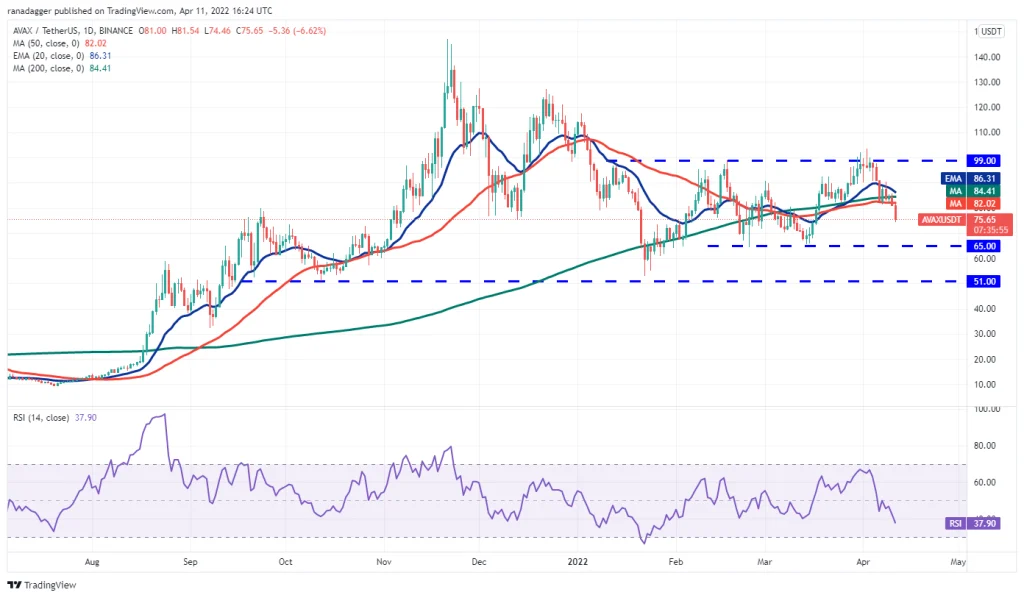
The slope of the 20-day moving average is bearish and the relative strength index is in the negative area, which indicates the dominance of sellers in the Olench market. Vendors are now trying to bring the price closer to the next key support at $ 65.
A bullish return after hitting this level could keep the price between $ 65 and $ 99 for a few more days. Breaking the resistance of the 20-day moving average can increase the chances of the Olench crossing over $ 99.
- Resistances: 82-99
- Supports: 65
Polkadat (DOT)
Polkadat buyers have been defending support for the simple 50-day moving average ($ 19) over the past few days; But as they failed to break the 20-day moving average ($ 20), selling pressure continued to rise and the price fell below $ 19 yesterday.
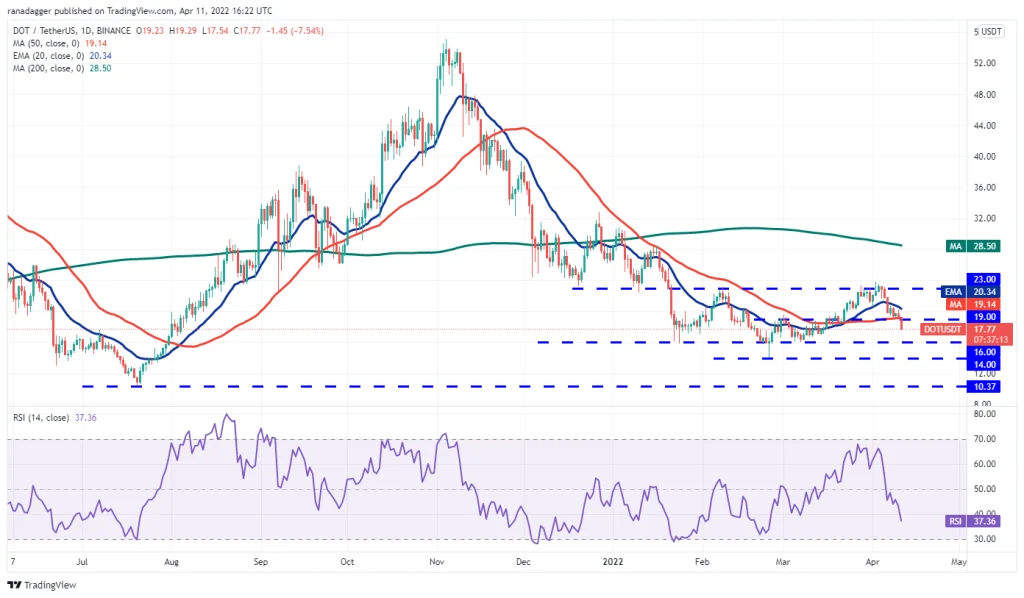
The slope of the 2-day moving average has been down and the relative strength index is in the negative area, which means that the market is controlled by buyers. It is now likely that the price will continue to fall to $ 16 and buyers in this area are expected to support Polkadat.
The return of Polkadat from this area can keep the price between $ 16 and $ 21 for a few more days. Breaking the $ 16 support or $ 21 resistance can also spark the next move.
- Resistance: 21
- Supports: 16
Dodge Quinn (DOGE)
Dodge Quinn buyers were trying to start an uptrend on April 10; But as the candlelight’s long shadow of the day shows, sellers have become more active as prices rise. They are now trying to keep the price below the 20-day moving average at $ 0.14.
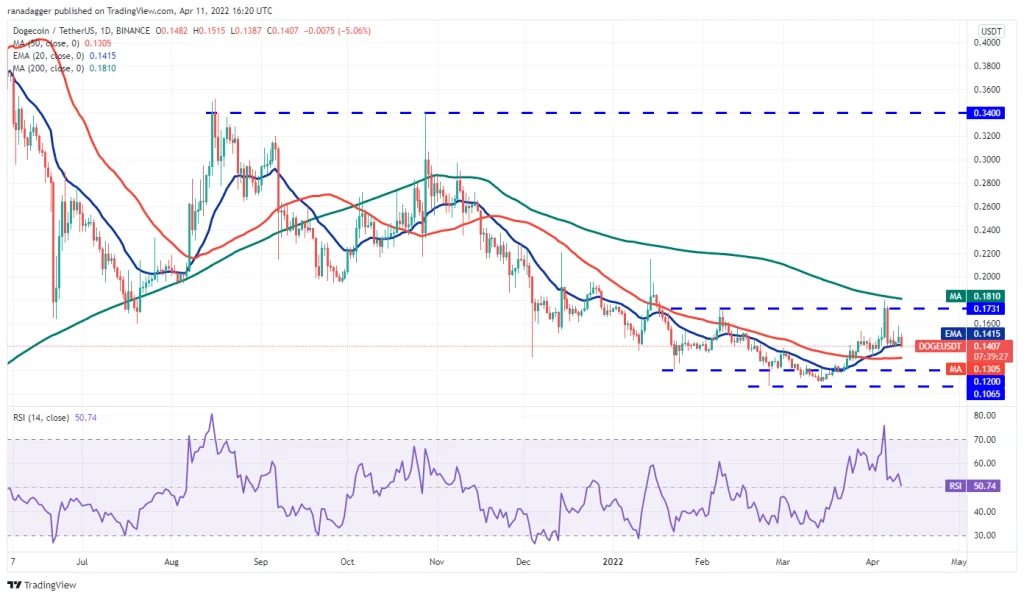
Sellers’ success in doing so could push the price towards the simple 50-day moving average at $ 0.13, after which the price will likely fluctuate between $ 0.10 and $ 0.17 for a few days.
The neutral slope of the 20-day moving average and the relative strength of the index near the mid-axis (level 50) can be considered a sign that limited price fluctuations will continue in the short term. A price jump from this level will once again encourage buyers to reach $ 0.17, and the passage of the price candle above the simple 200-day moving average at $ 0.18 could be a sign of the start of a new uptrend.
- Resistances: 0.17-0.18
- Supports: 0.14 – 0.13

