Weekly technical analysis of digital currency prices; When does limited price volatility end?

Since the beginning of 2022, with the fall in the price of Bitcoin, traders have been buying at price levels and jumping to temporary lows. Hence, during this period, the price has not had a specific directional movement. When prices fluctuate within certain limits, it means that both buyers and sellers are waiting for a directional flow to consolidate their market dominance.
Short-term price fluctuations are likely to increase after the US Federal Reserve announces its decision to raise interest rates on March 16. However, if the decision of the Federal Reserve is not surprising, the possibility of such a move will decrease. Even before the next price direction is determined, bitcoin can fluctuate for a longer period of time near recent levels.
One of the positive signs seen in the limited fluctuation of prices is that both small and large investors have used market conditions during this period to accumulate more units. This accumulation is accompanied by a decrease in the bitcoin inventory of centralized digital currency exchanges. The total bitcoin balance of the top 21 exchanges in the digital currency market has recently fallen to 2.32 million units, which is the lowest level since August 2018 (August 97).
Despite all these issues, can Bitcoin overcome the resistance in front of it and raise other pennies with it? To answer this question, we need to look at the chart of 10 selected currencies in the market.
Bitcoin (BTC)
Bitcoin has just returned to the top after hitting $ 37,000 support, which means buyers have strongly defended that support. They are now trying to push the price above the 20-day moving average (EMA) and the 50-day simple moving average (MA). Buyers’ success in overcoming these levels means an increase in demand in the price floor.
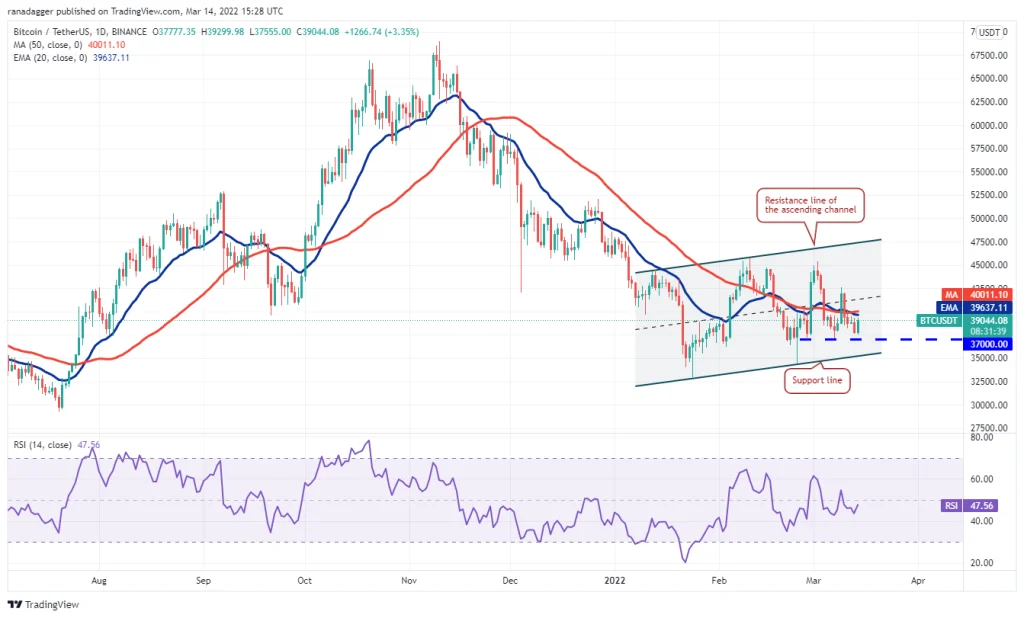
After this bullish defeat, buyers will try to break the resistance of $ 42,594. Their success in doing this means that sellers are gradually losing their superiority. Bitcoin will then have the chance to grow to resistance between $ 45,400 and the uptrend channel on the chart.
On the other hand, if the price moves down close to the moving averages, it means that sellers are still trying to maintain their superiority. Sellers will then try to stabilize their position, pushing the price below the support of the bullish channel on the chart. Such a move could be a sign of a resumption of the downtrend in the market.
- Resistances: 42.594 – 45.400
- Sponsorships: 37,000
Atrium (ETH)
Atrium buyers are currently trying to defend the symmetrical triangle pattern on the chart. Returning prices from this level can bring Atrium back to the level of moving averages, and after reaching this area, we have to wait for the resistance of sellers.
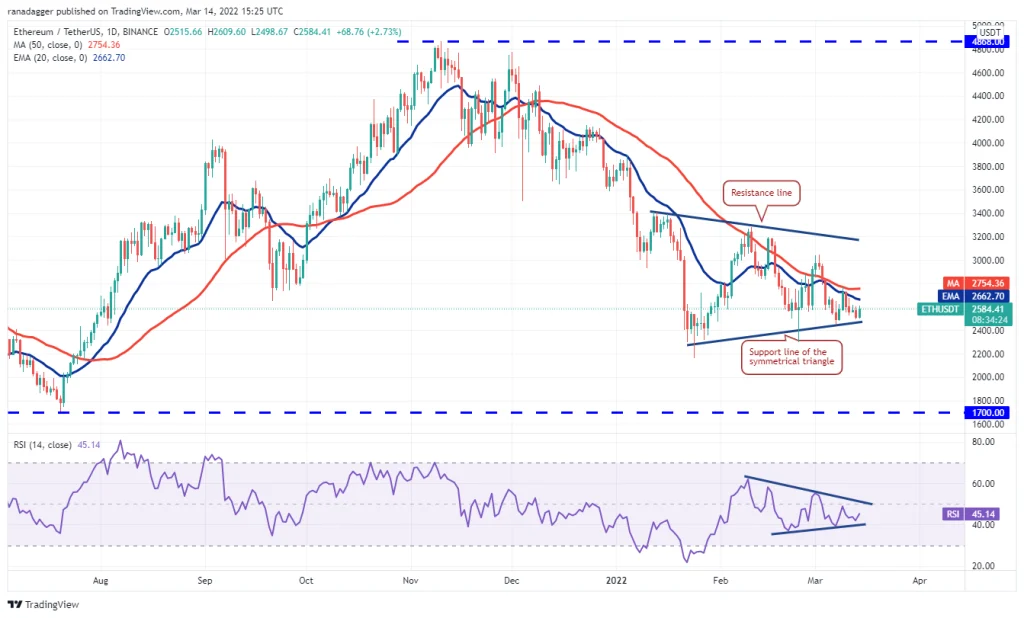
If the price falls below the level of moving averages, it means that market sentiment is still declining and traders are selling as the price rises. This will increase the likelihood of breaking the support of the symmetrical triangle pattern; A move that may be accompanied by the fall of Atrium to the support of $ 2,159.
On the other hand, if buyers can push the price above the level of moving averages, it means that the selling pressure may be further reduced. Atrium will then have the chance to grow to the level of $ 3,000 and then the ceiling of the symmetrical triangle pattern.
- Resistances: 3,000
- Supports: 2.159
Bainance Coin (BNB)
Binance Quinn is trying to get an upward return of support between $ 360 and $ 350. This shows that buyers are becoming more active near the price floor.
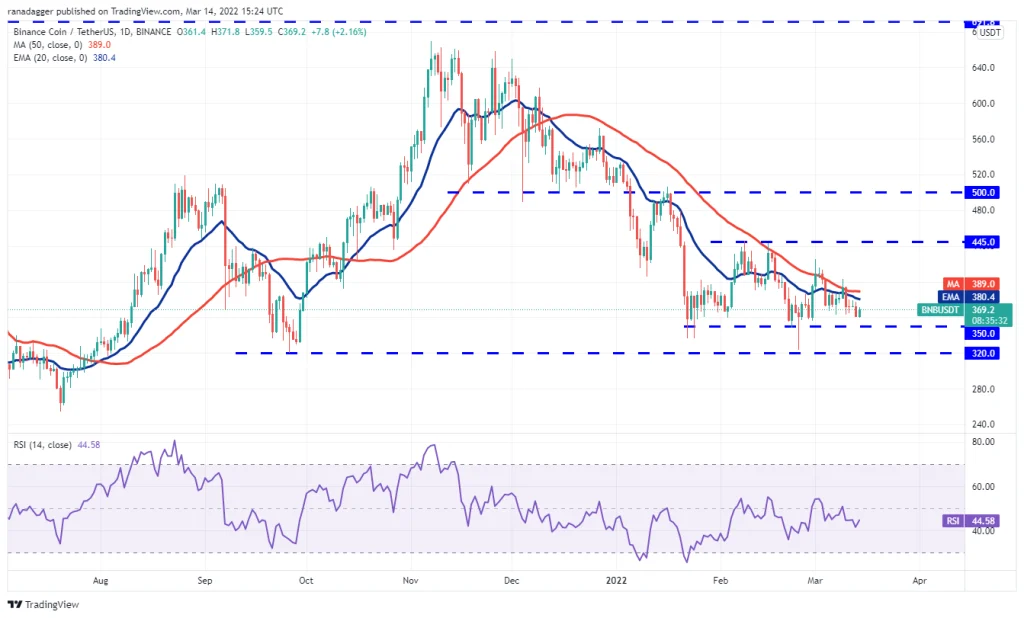
Buyers are likely to call everyone who looks appropriate, if there are only a few. If Bainance Quinn manages to stabilize above the 50-day moving average at $ 389, buyers will try to push the price to $ 425.
If the price falls below the moving average and falls below $ 350, this bullish outlook will be void. This confirms the negative sentiment of traders and the increase in selling pressure at price peaks, and could be accompanied by a fall in price to key support of $ 320.
- Resistances: 389 – 425
- Supports: 360 – 350 – 320
Ripple (XRP)
The price of Ripple crossed the bearish trend line on the chart a few days before the resistance and soon faced resistance at $ 0.85. This means that sellers have not yet surrendered and are still selling at high prices.
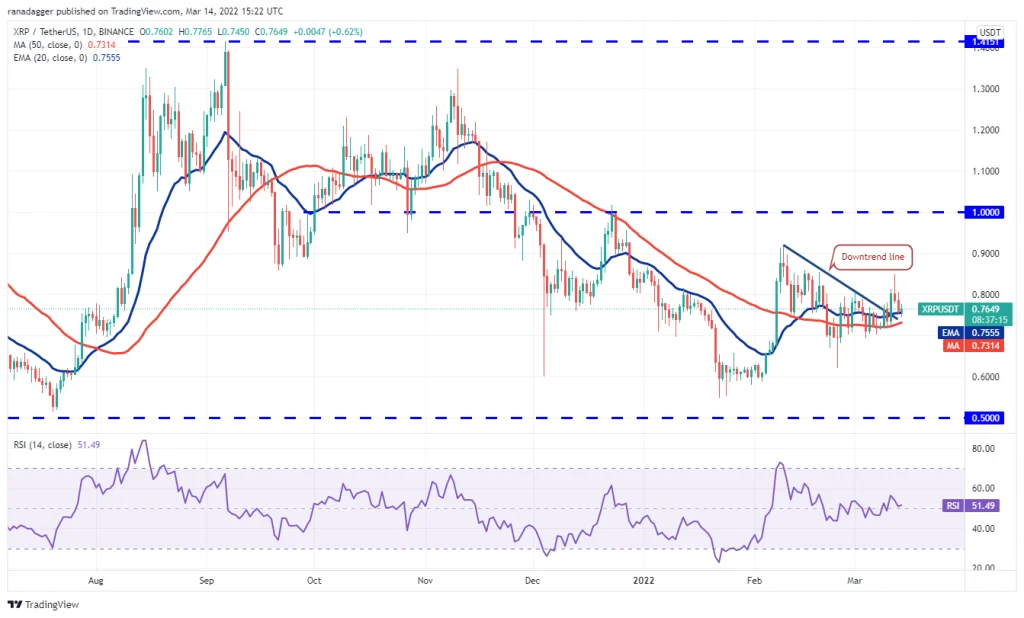
The price has now reached the 20-day moving average at $ 0.75, which will act as a strong support for Ripple. If the price starts a bullish return from this level, Ripple will have a chance to rise to $ 0.85. In that case, we would have to wait for the $ 0.91 resistance to break, and then the $ 1 psychological resistance.
Ripple falling below moving averages could erode the credibility of this bullish outlook. As a result, it can be said that breaking the resistance of the downtrend line on the chart was a bull trap. Breaking the $ 0.69 support will also pave the way for the price to fall to $ 0.62.
- Resistances: 0.85 – 0.91
- Supports: 0.75 – 0.69 – 0.62
Luna (LUNA)
Luna, Terra’s main token, had fallen below $ 94 a few days ago; But sellers failed to bring the price below the 20-day moving average at $ 82. From this it can be concluded that traders use the opportunity to buy more with each small drop in the market.
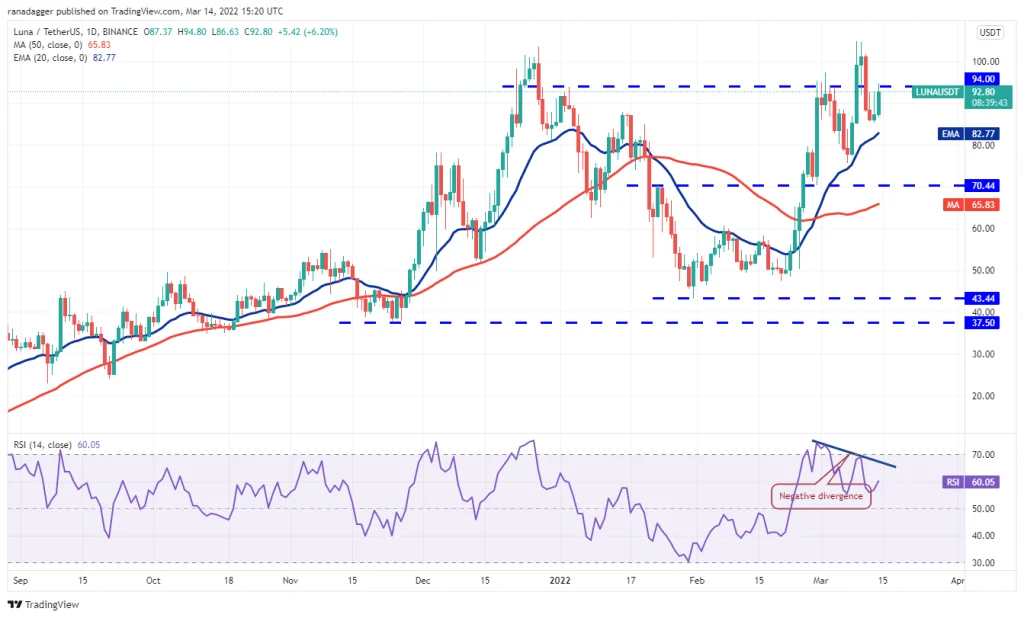
The upward slope of the 20-day moving average also confirms the superiority of buyers; However, the negative divergence of the price with the relative strength index (RSI) means that the upward acceleration of the price is likely to continue further.
Luna buyers are now trying to push the price above $ 94 again, and if they succeed, we will have to wait for the $ 105 resistance to cross. Breaking this level will open the way for Luna to jump up to $ 115.
On the other hand, if the price moves down after hitting the resistance ahead, sellers will try to bring Luna below the 20-day moving average.
- Resistances: 94-115
- Supports: 82
Solana (SOL)
Last Friday, the price of Solana fell below the strong support of $ 81, and on Sunday this week, this happened again with increasing sales pressure in the market. The $ 75 support is still intact.
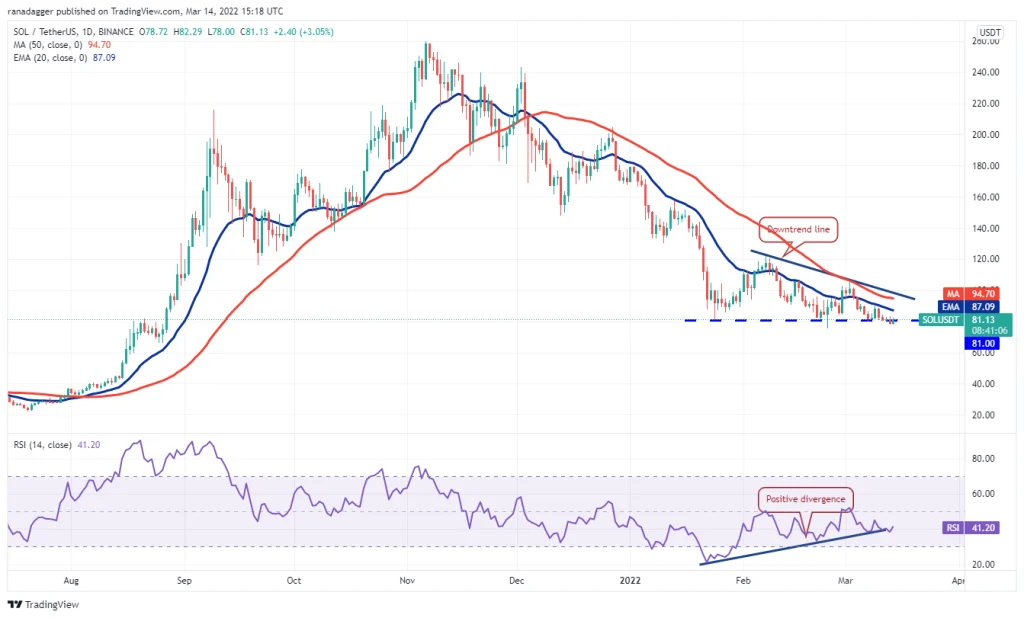
The positive divergence of the relative strength index indicates that the selling pressure is likely to continue to decline. Buyers are likely to call everyone who looks appropriate, if there are only a few. After that, the next goal of buyers will be to cross the 20-day moving average at $ 87.
If the $ 75 support continues to be lost, this bullish outlook will be eroded. This means that from now on $ 81 has become a new price resistance and Solana may fall to $ 66.
- Resistances: 94-115
- Supports: 75
Cardano (ADA)
Cardano is trying to start a new uptrend from the support of $ 0.74; But this move has apparently not been welcomed so far. The positive divergence of the relative strength index is one of the relatively upward signs in the market, which indicates that the selling pressure may continue to decrease.
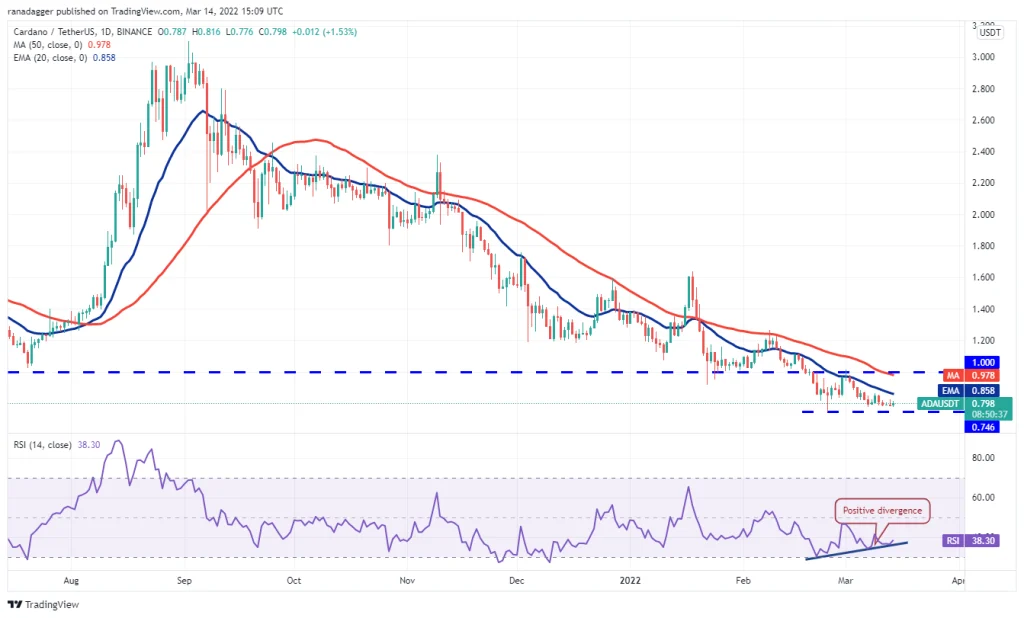
Breaking the resistance of the 20-day moving average at $ 0.80 could be a sign of losing the sellers’ superiority. Then the way is opened for the price to reach the key resistance of $ 1; But as Cardano jumps to this level, sales pressure is likely to increase as well.
On the other hand, if the price falls below current levels and moves away from the 20-day moving average, it means that traders are taking advantage of the opportunity to exit the market with every small price jump. With this downtrend, the price is more likely to fall to the support of $ 0.74 and $ 0.68.
- Resistances: 0.80 – 0.68
- Supports: 0.74
Ulnch (AVAX)
Two days ago, the price of Olench fell below the uptrend line on the chart, and this is a sign of the dominance of sellers in the market. Yesterday’s attempt by buyers to push the price above the uptrend line was also met by increased sales pressure.
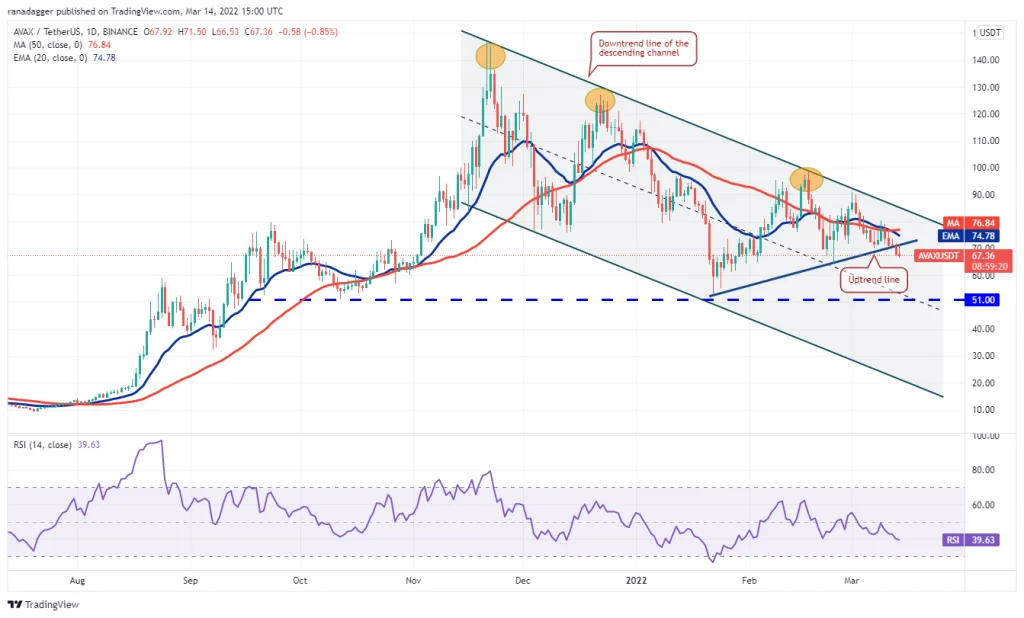
If sellers can keep Cardano below $ 64, the price is more likely to fall to $ 51. The downward slope of the 20-day moving average and the relative strength of the relative strength index indicate the superiority of sellers.
If the price starts to rise from the current levels and the resistance of the moving averages on the chart is broken, this bearish outlook will also be nullified. Olench buyers will then try to cross the downward channel ceiling on the chart.
The ascending channel ceiling is an important level that we must monitor, as buyers have already failed to cross this resistance four times. Crossing this resistance can increase the Olench to $ 100.
- Resistances: 100
- Supports: 64-51
Polkadat (DOT)
The price of Polkadat went down to $ 18 two days ago after hitting a simple 50-day moving average; But buyers have so far not allowed the price to fall below the 20-day moving average at $ 17.
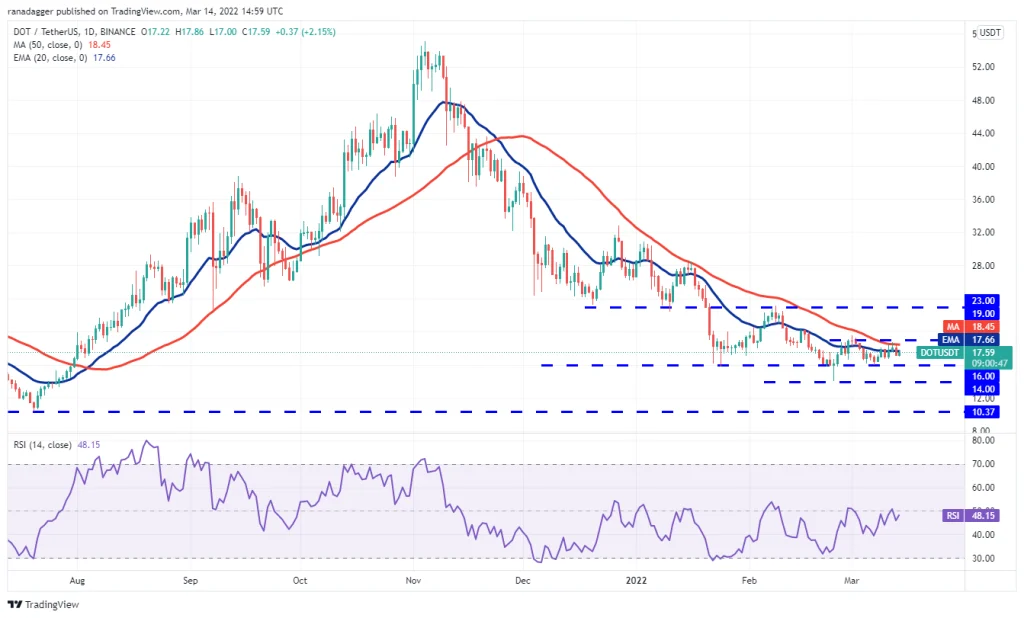
Prices have been hovering between $ 16 and $ 19 over the past few days, indicating that both buyers and sellers are hesitant. Such a limited fluctuation is not usually followed by a significant movement.
If buyers can push the price above $ 19, the way to jump to the $ 23 level will be paved. The passage and closing of the high price candle can also be a sign of the end of the downward trend of Polkadat.
On the other hand, if the price continues to fall below the $ 16 level, we should expect the spread to extend to the $ 14 support.
- Resistances: 19-23
- Supports: 16-14
Dodge Quinn (DOGE)
Dodge Quinn made a serious effort yesterday to start a new uptrend; But the move continued with resistance as the price reached the 20-day moving average at $ 0.12.
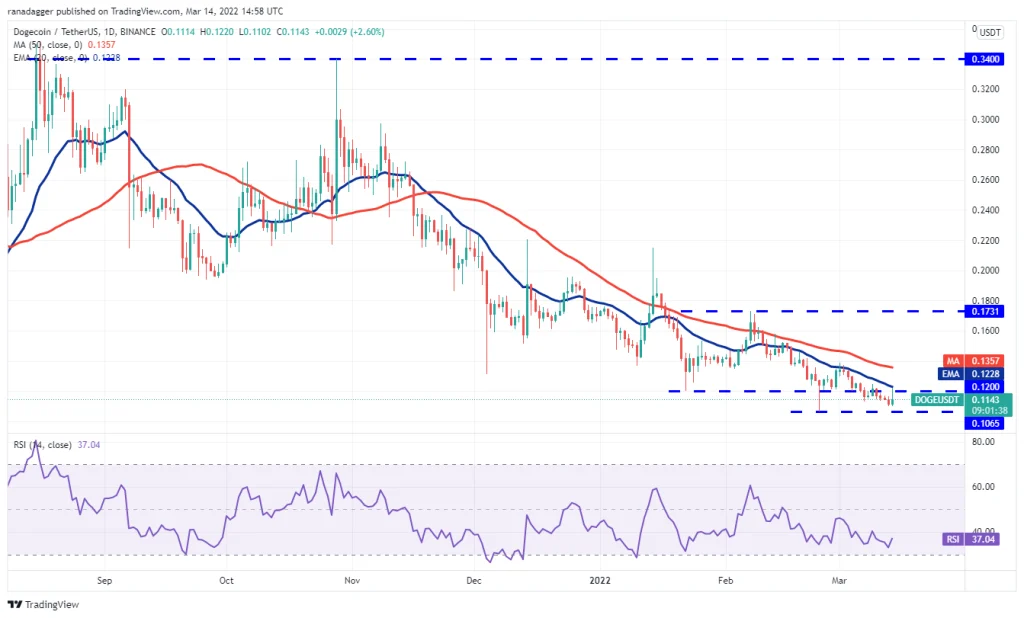
If buyers fail to break the 20-day moving average, sellers will test their chances of pulling the price below $ 0.10. In this case, the increase in sales pressure may be accompanied by the Dodge Quinn falling below $ 0.06.
On the other hand, if the price rises from current levels or corrects higher after hitting $ 0.10, it is a sign of lower buyer support. Buyers will continue to push the price above the simple 50-day moving average at $ 0.13 to suggest that there may be a change in the overall Dodge Quinn market trend.
Resistances: 0.13
Supports: 0.10 – 0.06

