What I Learned from Analyzing 1000 Initial Coin Offerings (ICOs)

Initial coin offering (ICO) events are one of the methods of providing capital for startups and emerging collections. On the other hand, the investors of ICOs try to be the first buyers of native tokens of these projects in order to get the most benefit from the growth capacity of these assets. Therefore, it seems necessary to examine the performance of initial coin offerings and their profitability.
Read more: What is an Initial Coin Offering (ICO)?
In this note, something You are reading an analysis by an author named Ren & Heinrich on the Medium website, which was written by examining around 1,000 ICO events between 2019 and 2022. By reading this article, you will probably gain a better understanding of how ICOs work and be better able to decide on future investments in this area. Read the rest of the article quoted by Ren & Heinrich.
Token priceTheHi ICOI see
I (the author, Ren & Heinrich) have collected the data of this study from a total of 983 ICOs between January 2019 and October 2022 (December 2019 to October 2021) and with their help I have analyzed the price performance of the tokens issued from the first day to the 365th day.
As you can see in the chart below, most of the ICO events took place in 2021 and 2022. In this article, the issue of the date of the ICO is important in the process of data interpretation, which I will mention later.
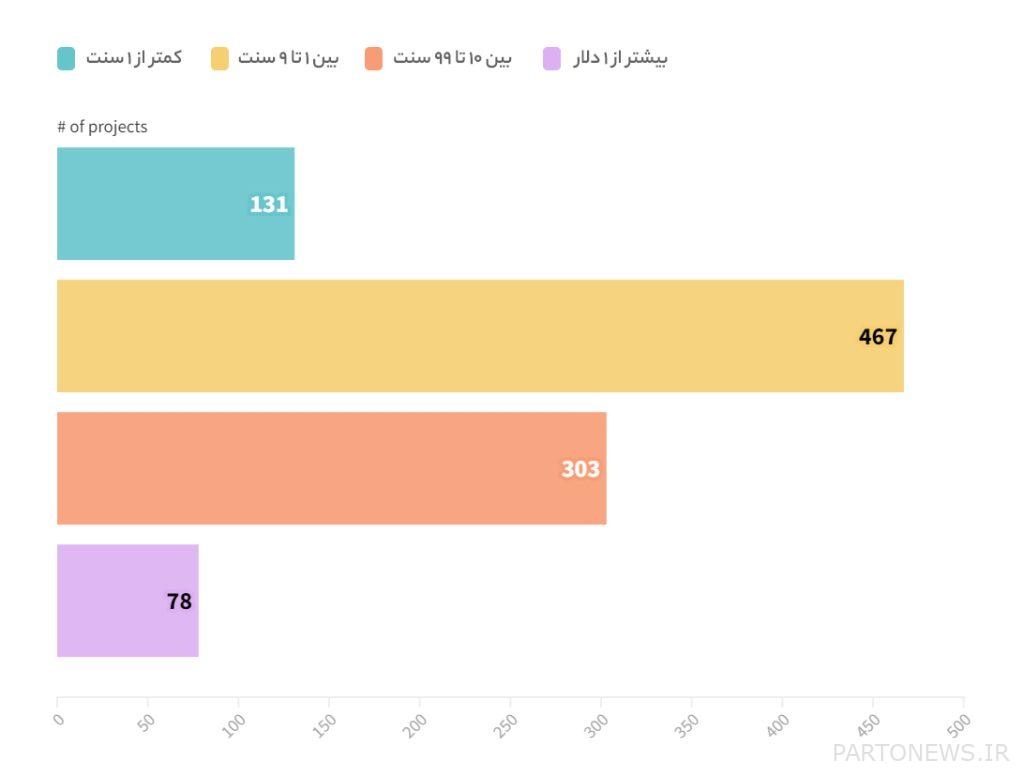
In the chart below, you can see the price distribution of ICO tokens, which shows the value of coins or tokens at different stages of the funding process. It is important to note that most of the projects set the initial price of only a few cents, and less than 10% of the projects consider the price of one dollar or more for their tokens.
Based on the conversation with the managers of various digital currency projects, they often choose a small price for their offered token for psychological reasons. Many less experienced investors seem to see the token’s low price as an indication of its future growth potential. However, as we will see below, this assumption is wrong.
Read more: 7 ways to earn money from digital currencies without trading
Objectives of ICO fundingI see
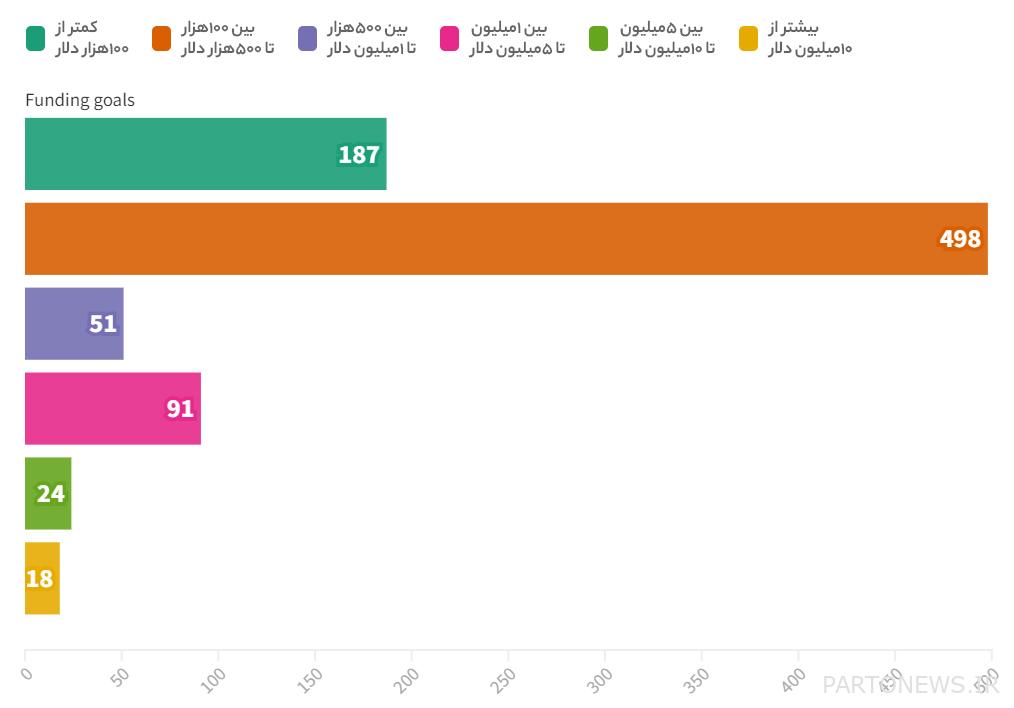
As you know, initial coin offerings have a minimum level and a final goal to secure their capital. Most of the projects examined in this study held their ICO event with the goal of securing at least $500,000 in capital with goals of $1 million or more.
In addition, it is interesting to know that the average project funding goals in 2019 and 2020 and to a lesser extent in 2021 were much higher than this amount in 2022. There are two explanations for this:
- Most of the reviewed projects held their ICO events in 2021 and 2022. Therefore, the higher “number” of the average reduces the capitalization goals for these years.
- Between 2019 and 2021, conditions for securing capital were better than in 2022. This issue is consistent with the reports of the financial sector of startups in 2022. In 2022 and with the decline of the market, it has become much more difficult for startups to secure capital.
Performance of ICOs after public offering on the first day
Now, let’s get into the main part of this analysis. In this section, the performance of the tokens of the reviewed projects during one day after the public offering has been analyzed.
Read more: What is a trade and who is a trader?
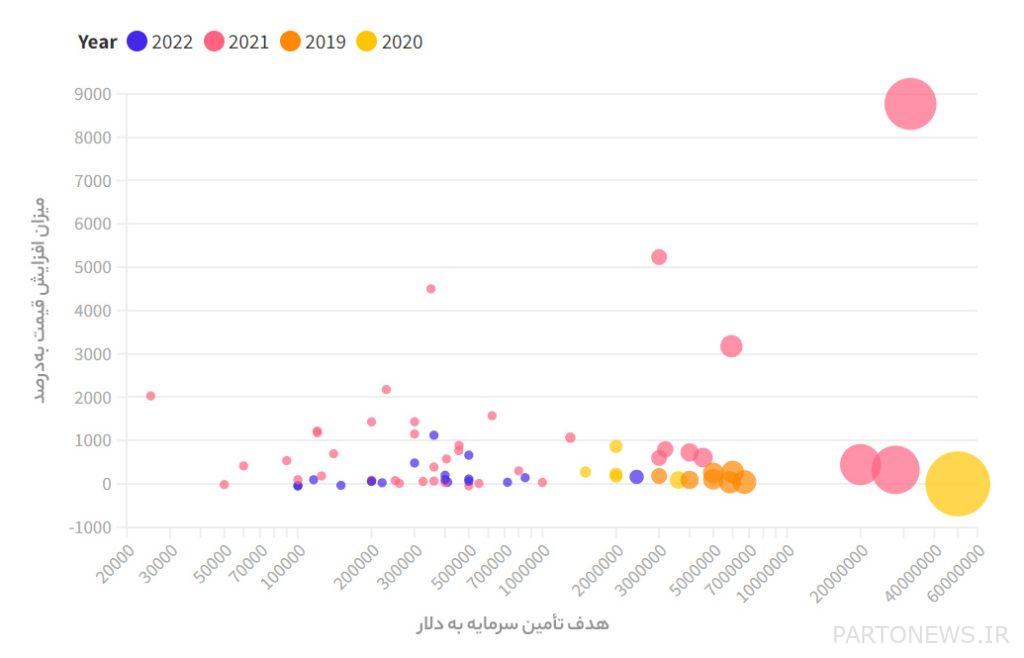
As the data shows, the average token price of the reviewed projects showed a significant growth on the first day. However, the data was highly scattered; Because some projects saw a growth of several thousand or ten thousand percent.
Statistically, an average growth of 253% with the first quarter of 74% and the third quarter of 766% was observed regarding the performance of tokens one day after the launch. The graph below depicts the performance of some of the analyzed projects on the first day.
Performance of ICOs after public offering on the 365th day
tip: Since at the time of data review, less than 365 days had passed since the public offering of the 2022 projects, I used the last available price.
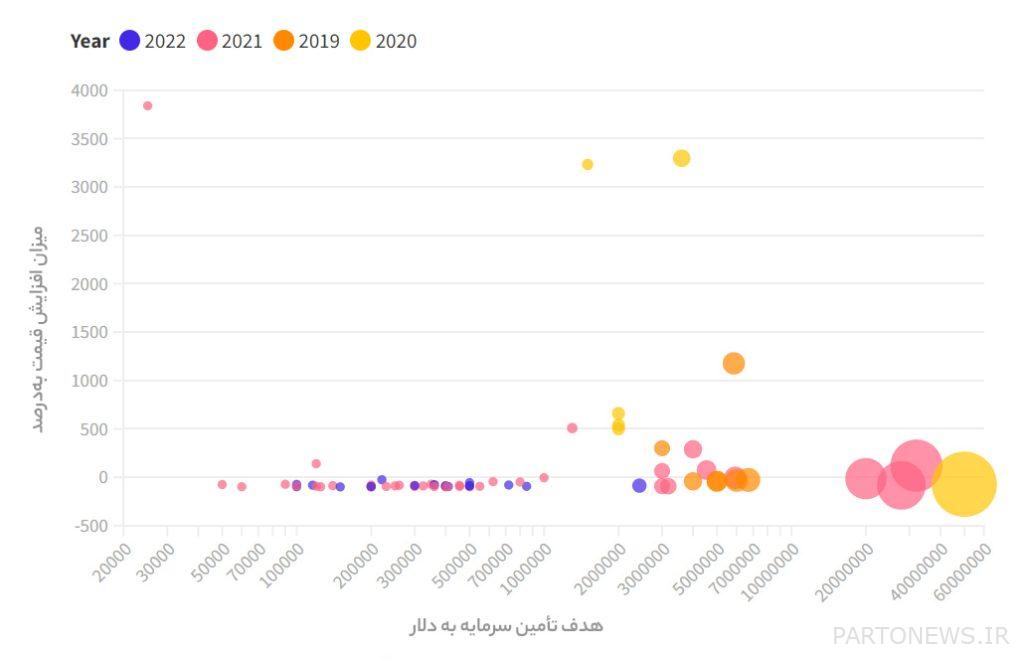
A year later, the picture looks very different for most projects. The amount of token drop in the middle of the data was estimated to be 80%, the first quarter to 93%, and the third quarter to 15%. In fact, after 365 days, most coins and tokens have lost between 80 and 90% of their value compared to their initial ICO price.
If we measure the price drop by the value of the token on the first day of public offering, the situation looks even worse. In this case, the drop in token value is more than 90% in most projects.
In the graph below, you can see the performance of the token price in different projects. The relatively successful performance of token projects in 2020 can be related to the bull market of that year.
Read more: Why do most cryptocurrency traders lose money?
Performance of ICOs over time
In order to better understand the development of each project over time, I recorded the performance in four time periods: Day 1, Day 10, Day 60, and Day 365. This issue is shown in the diagram below for a representative example of projects. The numbers behind the names of the projects show the rate of token price growth. What this chart doesn’t show well are the many projects that have regressed in terms of token price over the course of a year.
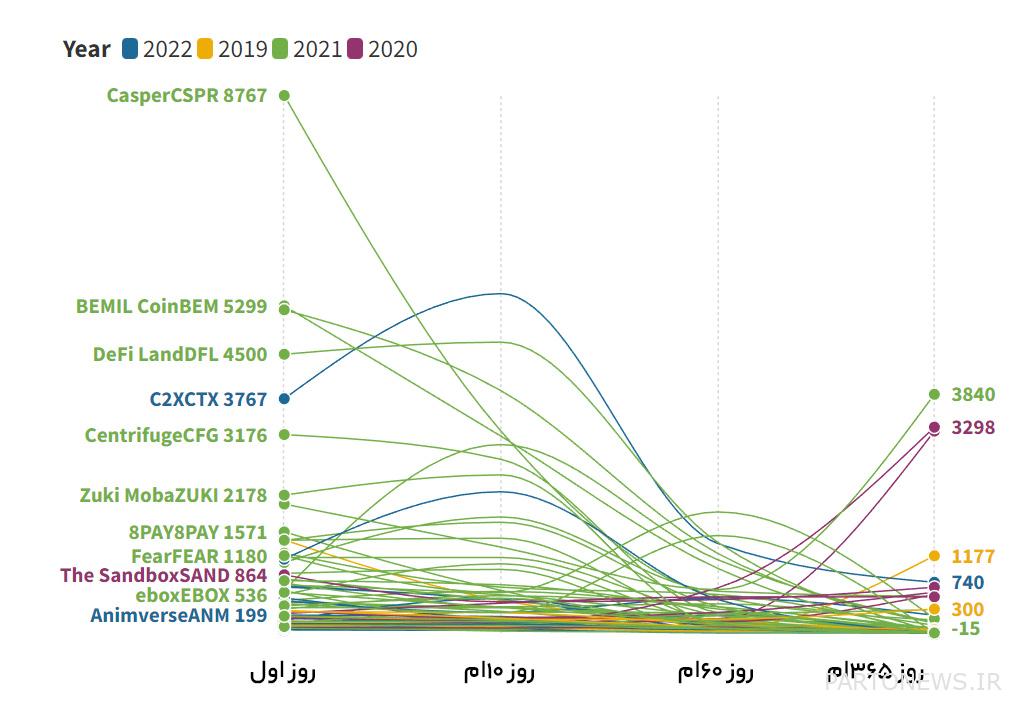
In the meantime, the point that we should pay attention to is the massive sale of early investors within a few days after the public offering of the token. Sometimes the influx of small investors during the first two weeks means that the price is slightly higher than what is shown on the 10th day. However, almost most of the time, the price of the tokens has dropped drastically on the 60th day.
TotalTheclassification
Based on this research, ICO investors can consider some points and conclusions about new projects:
- Investing in ICO events at the funding stage will often be accompanied by a significant price jump early in the public offering; Provided, of course, that the liquidity available in the exchange of your choice allows you to sell your tokens within the first few days of the public offering.
- Anyone who buys the project’s token within the first few days after the public offering will most likely have to wait for a big loss in the first year after the offering. To put it simply, if you buy right after the token is listed and publicized, you are only providing liquidity to the early investors and will likely suffer in the future.
- The results of this research are in line with and confirm other reports that often indicate the failure of new projects.
- Anyone planning to hold a new project token for the long-term should pay attention to the long-term cycle of Bitcoin. Projects released in 2020 benefited from the bull market of 2021; While projects released in 2022 are often caught in the current bear market.
Read more: 5 Lessons I Learned From Ignoring Bitcoin
- The amount and size of the goal of providing capital did not have much effect on the performance of each project. In other words, the large amount of capital collected in the funding stage does not guarantee the complete success of the project.
- The price of the token at the time of the initial coin offering event does not have much effect on the future performance of the project.
- Based on the data collected in this research, a number of projects that tried to raise capital through several different platforms performed the worst in the long run.

