What is head fake in digital currency transactions?

Have you ever bought a stock or digital currency that you thought was going up? But suddenly the process has changed? Or you sold stocks or digital currency quickly for fear of falling; But then have you seen that the price has grown contrary to your imagination? If so; So probably with head fake you have dealt
This has happened many times to traders and it was named after a movement in the world of sports. In this movement, the player moves his head in a certain direction, but continues his path in another direction. By doing this, the opposite player is deceived and suffers from delay and indecision, and he cannot well guess the path of the opposite player and defend.
In addition to sports competitions such as football or basketball, head fake movement is also used in stock markets and digital currencies. In this article, we are going to examine the concept of head fake in the world of digital currencies and its types and how to recognize it in the price chart of digital currencies; So stay with us until the end of this article.
What is a head fake?
A head fake is a sudden reversal of the price movement of digital currencies. This inversion may occur in both upward and downward directions. A bullish head fake is a state in which the price of digital currency is expected to increase; But suddenly the direction of the price changes and becomes downward. A bearish head fake is also a situation where the price should decrease based on the evidence; But suddenly it changes direction and increases.
In fact, head fake causes traders to get caught in wrong trades. When a trader with a 10% growth in the price of digital currency feels that its growth will continue, he opens a long position; But the problem is that with a 10% fall in the price of that digital currency and its liquidation, the trading position faces a loss.
The 100-day and 200-day SMA indicators indicate historical support and resistance levels, and head fakes often occur near these levels. Head fakes occur in a range or neutral market where the price movement does not have a clear trend. For example, if the annual average of Bitcoin is $30,000 and stays in the same price zone for several months, in such a case, it becomes difficult to predict the future movement direction of Bitcoin and the probability of a head fake event increases.
Read more: How to trade in Range-Bound market?
When the price movement has a certain upward or downward direction, head fakes happen less. If we are in a strong bull market where Bitcoin and altcoins are hitting new highs every week, it is easy to predict that this trend will continue upwards and it is unlikely that the situation will reverse without something special happening.
In long-term bear markets, it can be predicted that the downward trend will continue without any major head fake. Psychologically, head fakes can rush traders and trigger them to open false trading positions. There are two extreme emotions, especially in volatile markets like cryptocurrencies, that head fakes exploit and hurt traders: one is “fear of missing out” or FOMO, and the other is fear that often leads to panic selling.
Read more: What is FOMO in the market and how to avoid it?
The trader buys at a higher price due to “fear of missing out” or opens a long position when prices are falling due to the occurrence of a head fake. Hasty selling also causes the trader to sell his currencies earlier than the right time and lose by increasing the prices.
Common head fake models in the digital currency market
In the world of digital currencies, there are two types of head fake: bullish head fake and bearish head fake. Both types of head fakes are important for traders; Because ignorance of it may lead to the loss of their capital. In the following, we will describe these two types of head fakes with an example of the Bitcoin trend.
Bullish head fake
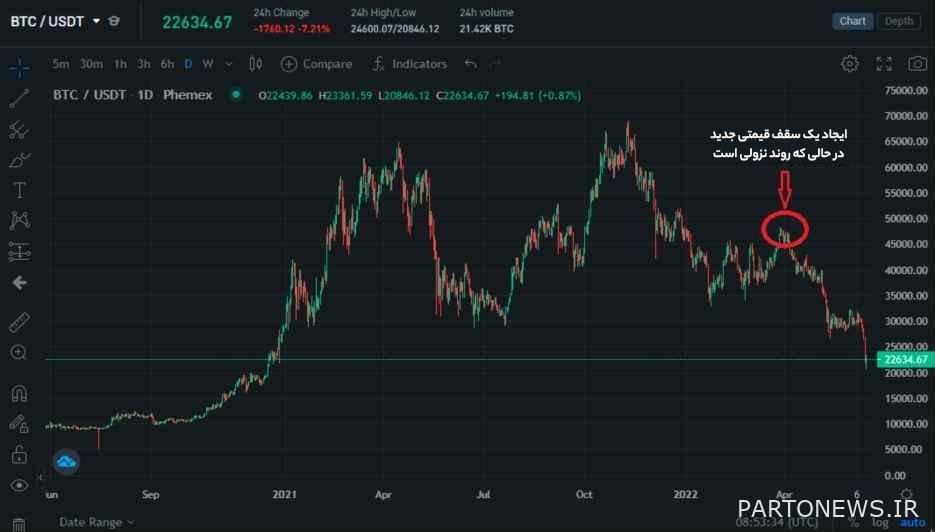
In the chart below, you can see an example of a bullish head fake, which shows one of the last few months of Bitcoin head fakes. Bitcoin price fluctuated in a neutral zone between $35,000 and $40,000, before a jump to $48,000 in April (red circle); But in the following months, the price will fall rapidly. When the buying pressure rejected the resistance level, some traders assumed that the trend would continue higher. However, they fell into a fake bounce trap and at the exact same time the trend turned down and prices collapsed.

Descending head fake
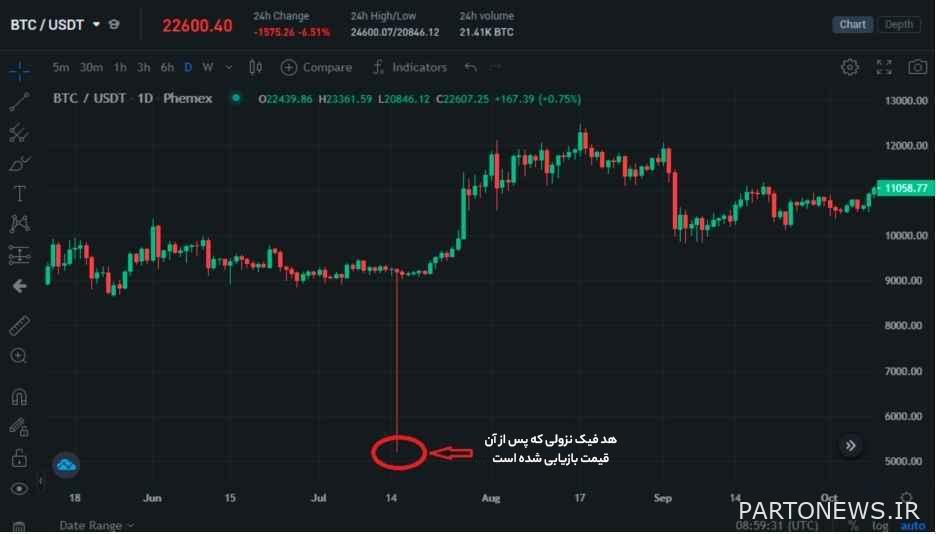
The most obvious examples of bearish head fakes occur in flash crashes. Bitcoin and other digital currencies have experienced sudden falls several times; So that their price has decreased by 40% in just one day. One of the most important examples of Bitcoin’s bearish head fake occurred in March 2020 at the beginning of the Corona epidemic. At that time, the price of Bitcoin fell from $9,200 to $5,100 in one day. Those who sold their bitcoins at that time lost about 50%.

While the drop in the price had convinced the traders that the value of Bitcoin would reach zero on the same day, the price suddenly entered the recovery process and this inverse movement continued in the upward direction in the following days. In the chart above, you can see how deceptive the candle we marked is. This candle indicates that the price of Bitcoin recovered on the same day and that the massive selloff was just a head fake.
How to recognize head fake?
Detecting a head fake is the hardest thing a trader can do; Because it requires effort and time and experience. Of course, experience is the most important way to recognize this pattern. In addition to experience, there are other methods that we will mention below.
1. Review of basic resources
One of the effective strategies for detecting head fakes is to understand the factors that drive the price of digital currencies. The digital asset market is now a trillion dollar industry that is somehow connected to global stock markets. If the global economy is in a bad situation, it will most likely be reflected in the digital currency market. Bitcoin is the largest digital currency in terms of market value and it is traded on Wall Street with trillions of dollars of assets by big banks and investment funds; Therefore, if the US stock market goes into recession, asset management companies will sell their cryptocurrencies in an attempt to cover their losses.
It should be noted that Bitcoin price movements are not random. At the same time, instability and inflation and changes in interest rates by the Central Bank of America can shock the stock market, and this shock is immediately reflected in the digital currency market. Also, if the stock market is bullish, we will see a bullish market in digital currencies. This relationship was proven during the bull market of 2020 to 2022 in the world of digital currencies. This bull market was comparable to the biggest bull market in the history of stock markets. When the stock market corrected after this period, the digital currency market followed suit.
Knowing the state of the world economy and how it affects digital currencies is more important for novice traders than knowing a thousand and one technical indicators.
Most altcoins have a positive correlation with Bitcoin in terms of price movement; Unless there is positive or negative news about a particular altcoin. For example, if news of an institutional investment in an altcoin or a related security breach or hacking attack is released, it will cause the price to rise or fall independently of Bitcoin.

2. Use of long-term indicators
Long-term indicators help traders identify major support and resistance levels. In addition to being aware of global economic events, traders should use indicators that emphasize long-term data to detect important levels and fake heads. To analyze current price levels in comparison with historical price levels and determine the future direction of prices, it is better to use a one-day or one-week chart. The best long-term indicators for trading digital currencies are:
These oscillators help the trader to determine whether the current price movement is justified or not. In other words, the trader should see if the amount by which the price has decreased or increased is significant enough to wait for an upside bounce.
3. Trending market detection
Trading in markets that have a certain trend, i.e. trending market, helps traders avoid getting caught in head fakes; Because these types of markets have a predictable pattern. In an uptrending market, prices continue to rise despite temporary drops, and in a downtrending market, the opposite happens. Traders can also use oscillators such as the Klinger Oscillator (KO) and the True Strength Index (TSI) to detect a trending market, which directly measure the strength of the trend.
Big and popular head fake examples in the market
The historic bull market that started in March 2009 has seen several head fakes over the past decade. One of the famous examples of these head fakes is the “Flash Crash” of stock prices on May 6, 2010. In this sudden fall, the Dow Jones Industrial Average (DJIA) fell about 1,000 points in a few minutes; But by the time the market closed, most of this loss was compensated. Some traders thought that this sudden drop signaled the beginning of a new bear market. Accordingly, they opened long-term bearish trading positions on US stock indices; But the American stock market witnessed growth and set new records and these traders were deceived by this head fake.
Another example of head fake is related to the shares of PayPal, which occurred on June 3, 2019. On this day, the PayPal stock price went below the 50-day simple moving average and the price floor on May 13, which was an important support area; But the next day, the stock closed above the support zone with a 3% price gain at the end of the day, which was a sign of a possible head fake. PayPal shares then continued to rise in subsequent trading sessions, and on June 10, when the price closed above the previous price ceilings, it showed that the crash was a head fake.
Conclusion
A head fake is a sudden change in the price of stocks and digital currencies. When digital currency has an upward or downward trend, its price may suddenly jump in the opposite direction; But this surge does not last long and the price returns to the previous trend. Such a reverse movement can deceive and scare traders and force them to make a hasty decision and close the wrong trading position.
Head fakes can be recognized; But this work requires sufficient experience and knowledge of technical analysis. In this article, we mentioned that in order to detect a head fake, you must first be aware of the fundamentals of the market and financial markets related to digital currencies. Also, we mentioned practical technical indicators for detecting head fakes and emphasized that knowing the trending market is also very effective in detecting head fakes.
The financial markets, especially the digital currency market, are volatile and different things can happen every day and every hour that can surprise the beginner or professional traders. Professional activity in these markets requires sufficient knowledge and, more importantly, a lot of experience; Therefore, to enter the digital currency market, it is better to do enough research and get the necessary training.

