Possibility of breaking Bitcoin and Oxy Infinity records; Five digital currencies that traders should be watching this week

The upside sentiment in the bitcoin market eased somewhat after the US Stock Exchange Commission on November 12 rejected VanEck’s request for a Bitcoin exchange-traded fund (ETF).
The next day, the news of the successful Teprot update was announced. Hampus Sjöberg, one of the leading Bitcoin developers who also launched the proprietary Teprot website, said the biggest victory for Bitcoin was that Teprot showed that the digital currency could upgrade its network for a lifetime. Networking is very important.
Decentrader analysts point out that the previous Bitcoin network update, SegWit, in 2017, continued to push the price from $ 4,000 to $ 20,000 in four months.
But can Bitcoin repeat its uptrend after the Teprot update and raise its pennies? In the following, we are going to examine the chart of five currencies that can follow their upward trend next week.
Bitcoin (BTC)
The price of Bitcoin returned to the 20-day moving average (EMA) a few days ago at $ 62,945, which is a significant level of support. Traders are also trading on the price floor, mainly during the strong uptrend of Bitcoin and after the price reaches the level of the 20-day moving average.
The uptrend of moving averages indicates that buyers are in control of the market, and a negative divergence in the Relative Strength Index (RSI) could mean that the uptrend is likely to slow down.
If the price continues to rise after hitting the 20-day moving average, buyers will try to push Bitcoin to a historic high of $ 69,000 and follow the uptrend. If the uptrend continues, it will be possible to reach $ 75,000.
On the other hand, falling and closing prices below the 20-day moving average could mean that traders are leaving the market in a hurry. After that, the price may fall to the 50-day moving average (SMA) at $ 57,938. Continuing the downtrend and breaking this support could also be accompanied by a deeper price correction to the level of $ 52,920.
Also read: How to use simple moving average and exponential for trading?
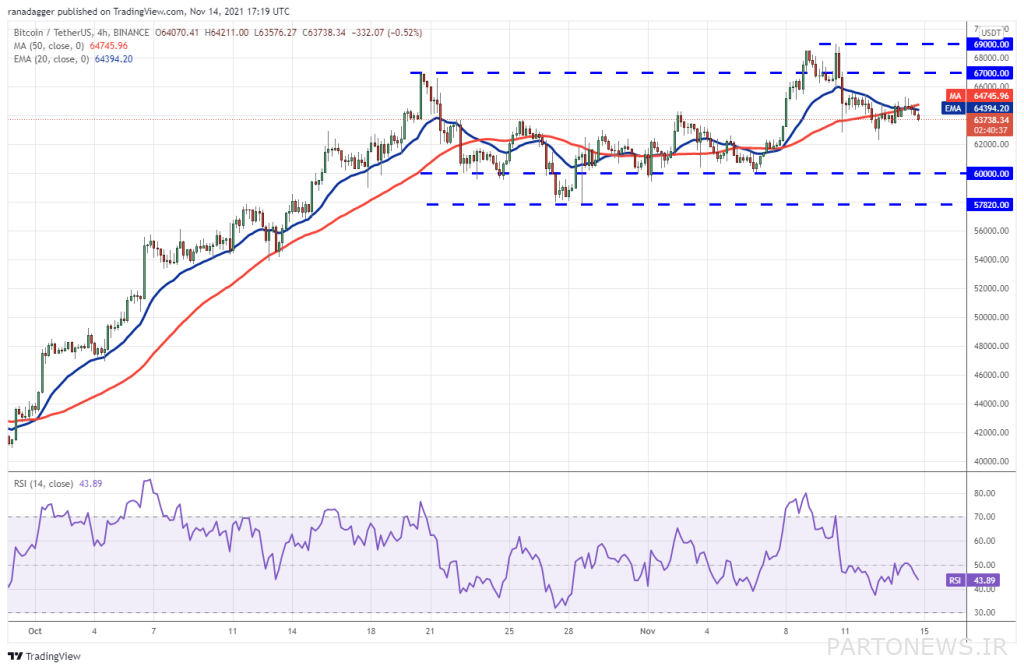
As the 4-hour market view shows, the price is fluctuating between $ 60,000 and $ 67,000. At some point, buyers pushed the price above the channel resistance, but were unable to maintain their position at this level. Now the price has re-entered the channel range.
The slope of the moving average of 20 candlesticks has slightly decreased and the relative strength index is below the mid-axis, which indicates that the price may gradually fall to $ 60,000. A strong return from this level can maintain the credibility of the channel for a while, but breaking it will probably mean a change in market trends.
On the other hand, if the price moves above the current levels, buyers will probably try to cross the resistance area between $ 67,000 and $ 69,000.
LightCoin (LTC)
After crossing and closing the candle, the high price of $ 225.30 resistance, the formation of the round floor pattern in the 1-day view of LightQueen market was completed. The price is rising rapidly and is approaching the $ 300 psychological resistance that sellers will be active in.
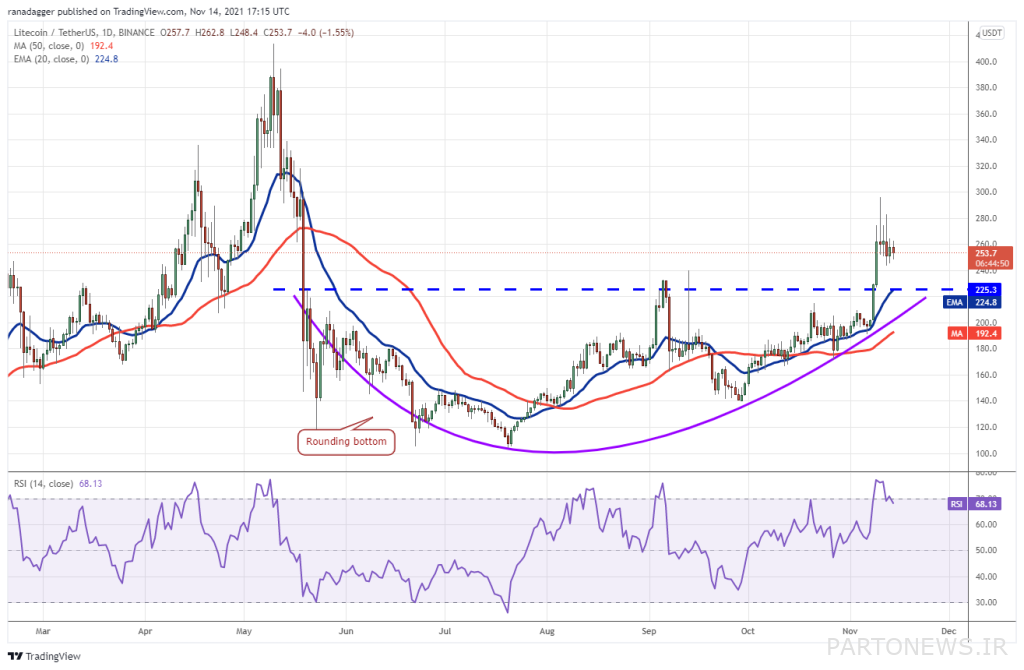
The Light Coin price has improved somewhat in the last few days, however, the 20-day moving average has started to move upwards and the relative strength index has been below the buy saturation range, which indicates that the market is in the hands of buyers. Buyers will try to resume the uptrend if the price starts to move up from the current levels or goes up after hitting $ 225.30.
Crossing and closing the $ 300 candlestick paves the way for $ 340. Sellers may have another plan and want to bring the price below the breakout level at $ 225.30 and maintain their position below this level. If they do, the price could fall to a simple 50-day moving average of $ 192.
Also read: Familiarity with 10 technical analysis chart patterns that every trader should know
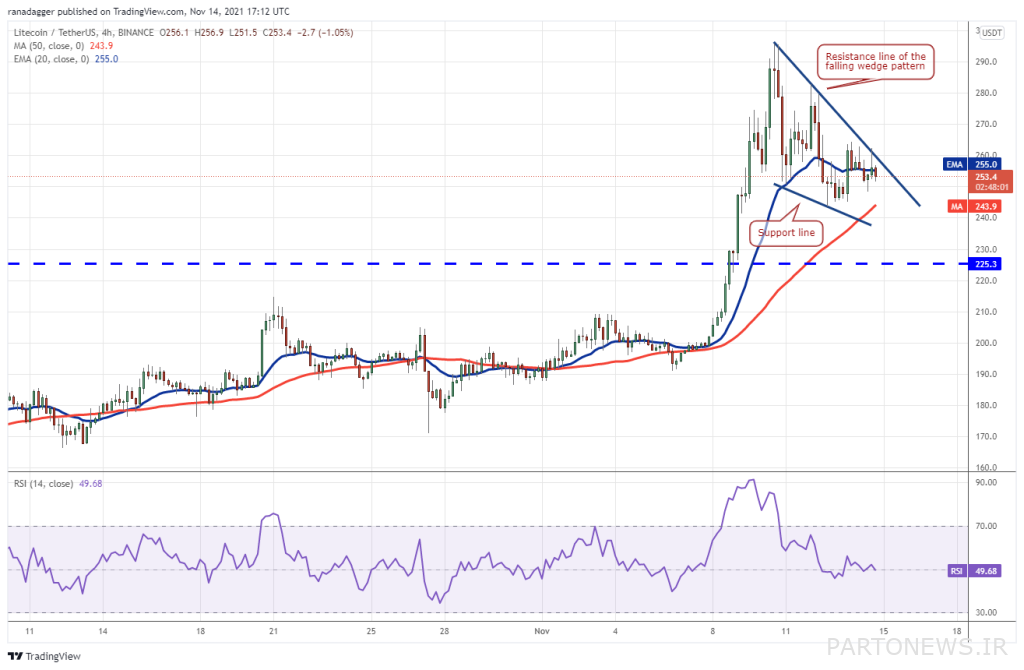
In the 4-hour market view, the price is fluctuating within the pattern of a decreasing angle. The 20-candle moving average has a neutral slope and the relative strength index is located near the center axis, indicating a balance between supply and demand.
If buyers can push the price above the resistance of the downtrend pattern, this balance will be lost. In this case, the price can go up to $ 280 and then $ 295.70. Buyers will face stiff resistance at this level, but if they can overcome this barrier, the price is likely to reach $ 302.10.
On the other hand, if the price falls below the simple 50-day average, the selling pressure will intensify and the price will probably fall to the next strong support at $ 225.30.
China Link (LINK)
On November 9, 10 and 11 (November 18 to 20), buyers raised the price above the resistance of $ 35.23, but could not maintain their position at this level. This shows that sellers are strongly defending this level.
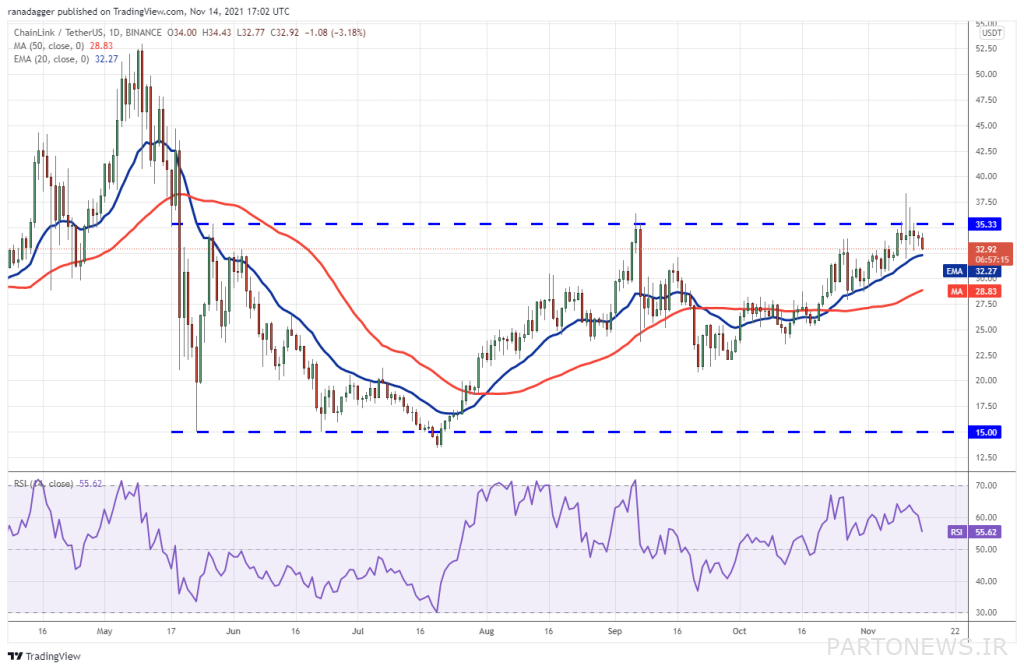
The slope of the moving averages is upward and the relative strength index is above the level of 55, which indicates the relative superiority of buyers. If the price returns to the upside after hitting the 20-day moving average, buyers will once again try to break the $ 35.23 resistance.
If they continue to do so, China Link could start a new uptrend. If the market is bullish, the first target will be $ 42.50 and then $ 47.50. But if the price falls below the moving average, the credit of this uptrend will disappear and the price may continue to fall to the 50-day moving average at $ 28.83.
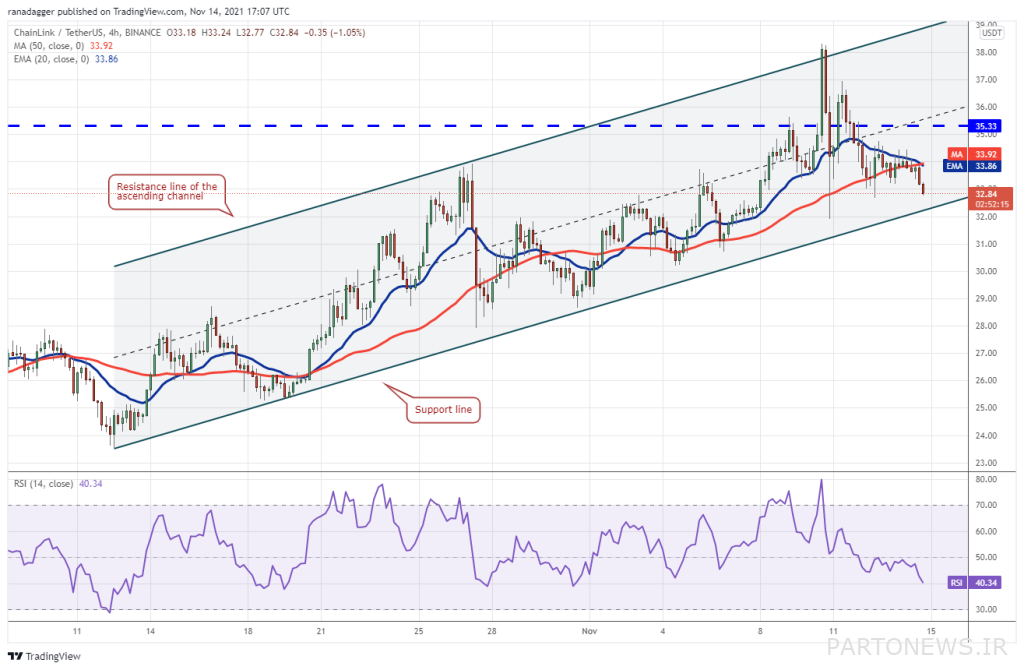
As can be seen in the 4-hour view, the price has been fluctuating for several days in an uptrend channel, and buyers once tried to break the resistance of the channel ceiling on November 10, but succeeded. They did not. This means that buyers have probably saved their trading profit at this level and sellers have entered short (sell) positions.
The price of China Link has now reached the support of the channel floor and may increase the buying pressure at this level. A strong price return from this level could indicate that buyers have been accumulating links on the price floor of China. Then the price can grow in the channel range. On the other hand, if the candle breaks the support price of the channel floor and closes below this level, it will be a sign for a change in the market trend.
Wei China (VET)
China’s price crossed the $ 0.15 resistance on November 4, indicating that buyers are stronger than sellers. The price then returned to the break-even level and the sellers also tried to trap the buyers by dragging China below this level.
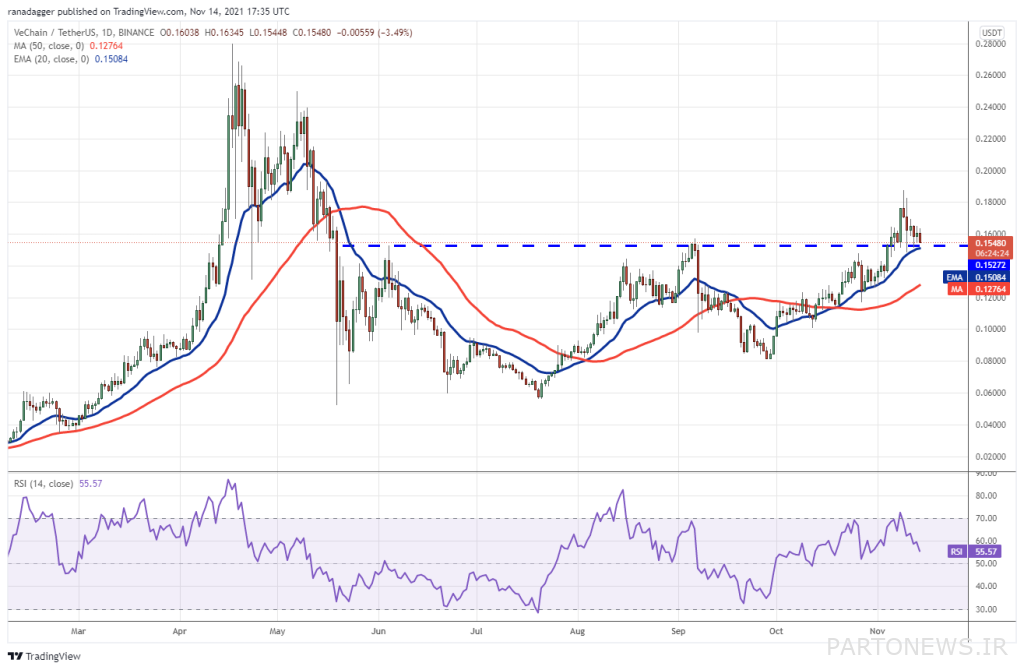
The slope of the 20-day moving average is bullish and the relative strength index is in the positive area, indicating the relative superiority of buyers. If the price rises above current levels, the buyers’ goal is to cross the $ 0.19 level, after which the price will reach the $ 0.24 level.
On the other hand, if the price falls below $ 0.15 and remains at the same level, it means that the market is probably not ready to accept higher levels. If the downtrend continues, the price will fall to the simple 50-day moving average at $ 0.12 and then $ 0.10.
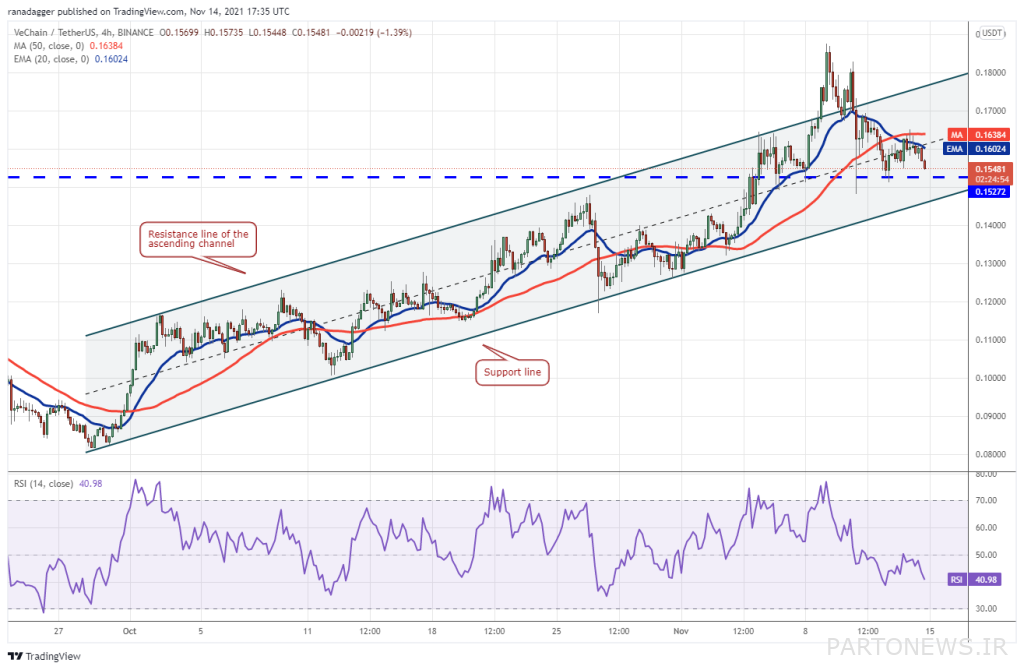
As can be seen from the 4-hour view of the market, buyers at some point raised the price above the resistance of the uptrend channel, but could not use this opportunity to their advantage. This indicates that demand for Wei China is declining at higher levels.
Prices are now back in the channel range, and moving averages have recently formed a bearish cross. This indicates that prices may gradually fall to the bottom of the channel.
If the price continues to move upwards from the support of the channel floor, the bullish outlook will remain intact and the price will probably fluctuate within the channel. In order for sellers to dominate the market, they must lower the price below the channel support and maintain their position there.
Oxy Infinity (AXS)
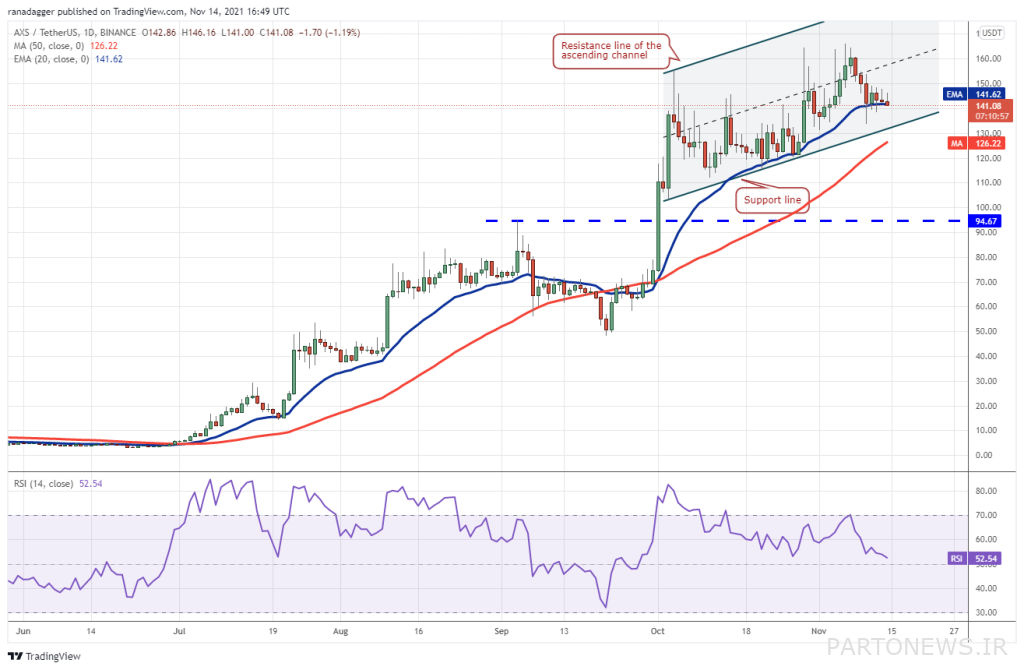
Oxy Infiniti is correcting the recent uptrend and the price has been fluctuating in an uptrend for a few days. The price has now fallen to the $ 141 20-day moving average and buyers are trying to avoid a deeper fall.
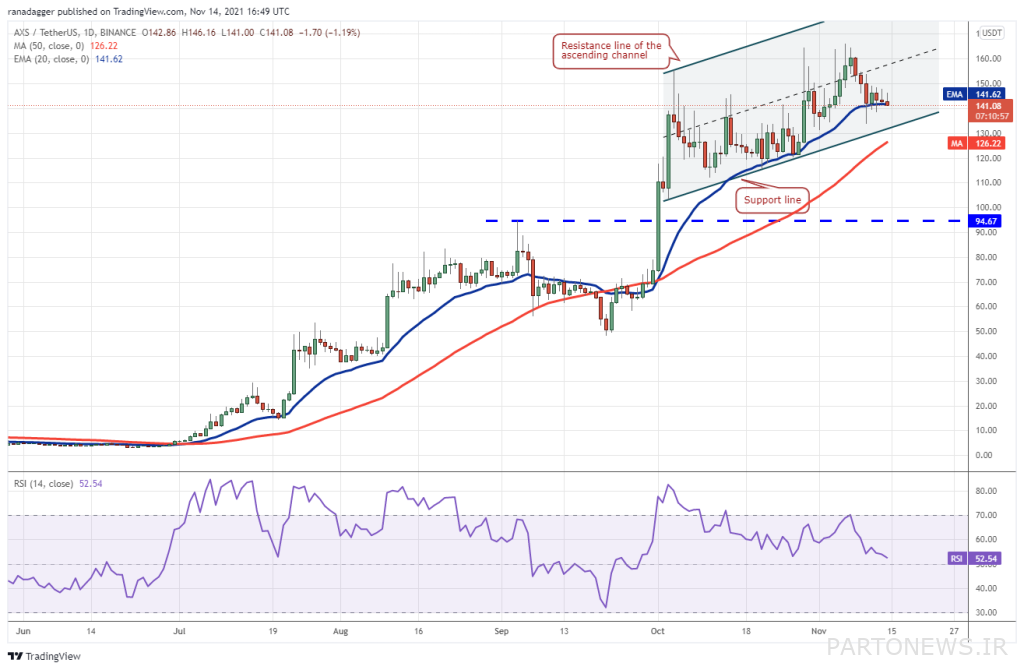
The slope of the 20-day moving average is neutral and the relative strength index has reached near the mid-axis, indicating that buyers are losing control of the market. Breaking the 20-day moving average can lower the price to the support of the channel floor.
Buyers are expected to support the price strongly at this level. If the price returns to the upside after hitting the channel floor support, it can be said that the uptrend remains intact. Buyers will then try to push the price to its new all-time high of $ 166.09.
The passage of the price above the previous historical high paves the way for the price to climb to the resistance level of the canal ceiling at $ 183. If the support of the channel is broken, the credibility of this upward perspective will be lost.
In the 4-hour view of the Oxy Infiniti market, the price is fluctuating between $ 166.09 and $ 131.18. The price candle is below the moving average of 20 candlesticks, which shows that sellers are strongly defending this resistance. This increases the probability that the price will fall to $ 131.18 supported by the channel.
If the price goes up after hitting this level, it means that buyers have been accumulating oxyinfinity on the price floor. The price will probably fluctuate in the channel range for a few days.
On the other hand, falling and closing prices below the channel floor support could mean a change in market trends in the short term. The price may fall below the support range between $ 115 and $ 120. If this support is broken, a deeper fall to $ 100 psychological support is likely.

