Technical analysis of D symbol / high potential for the rise of D bank shares – Tejaratnews

According to Tejarat News, the analysis of the price chart of Bank D shares in the last three years shows that after the 85% drop that lasted from August 2019 to December last year, the share was able to end its downward phase and start a new upward rally. .
The price of D was able to increase by 230% during this upward rally in just five months. It should be noted that the total index grew by only 85% during this period. Although the rise of the overall index was also considered a sharp growth, Bank D shares were able to surpass the overall index with this price increase.


The withdrawal of smart money from D
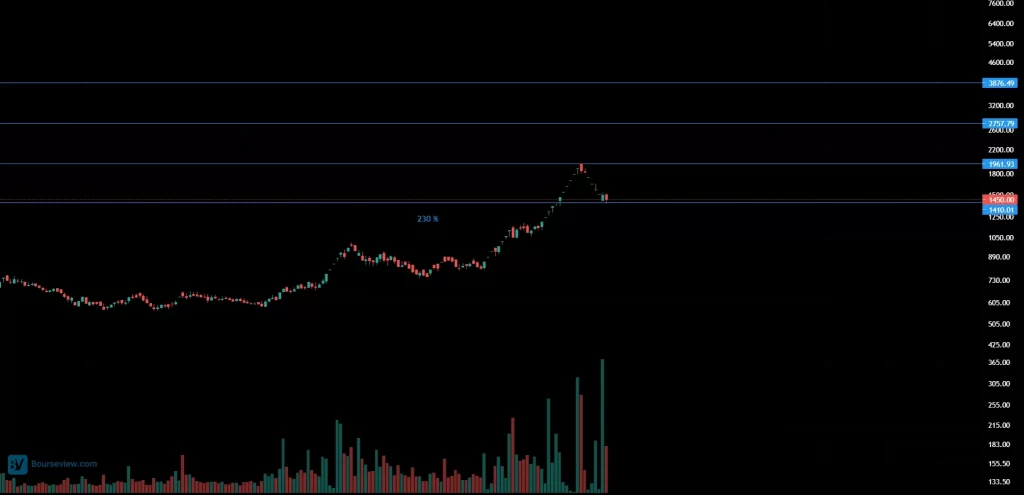

As it is clear in the chart, after dealing with the static resistance of 196 Tomans, Day faced an increase in supply from big money. Day’s price chart clearly shows that the share volume increased by three billion and 695 million shares a day before meeting this static resistance, and this withdrawal of money from the share caused Bank Day’s shares to no longer continue to rise.
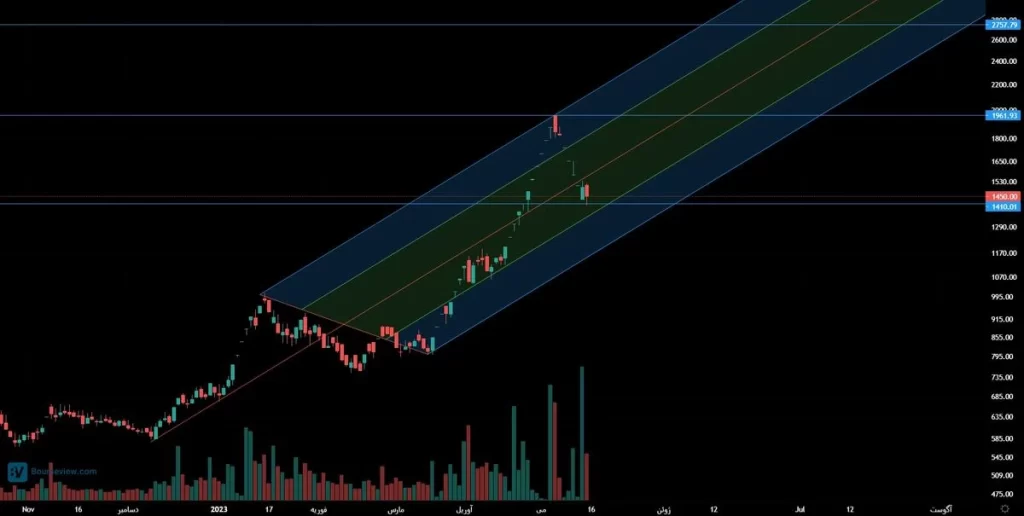
Drawing an Andrews fork on the latest upward trend of the stock also considers the reason for this money outflow to be the stock hitting the top of the fork. After hitting the fork roof, Dee was unable to break this bullish fork and began to correct. Now, however, the close MLH can prevent the stock from continuing to correct.
Signs of D’s tendency to ascend
Another positive point that this chart shows is the compatibility of the static support level of 141 Tomans and MLH near the Andrews fork at the end of May this year. This shows that Bank D shares have a high potential to finish their correction and climb again this week.
The relatively long shadow formed on the last trading day of the stock also indicates the tendency of Day to start the upward trend.
In general, it can be said that if D reacts to its support level of 141 Tomans, in the medium term, it can first reach the midline of the fork, then reach the level of 196 Tomans and finally reach the ceiling of the Andrews fork.
Also, among the long-term targets of D, we can mention the levels of 275 and 387 Tomans, which is also the historical ceiling of the share. It is important to mention that despite the record-breaking total index in recent months, Bank D shares have not yet reached the ceiling of 99.
Therefore, it can be said that, despite the pathetic state of its financial statements, it has good technical conditions to climb.