Technical analysis of Khasapa July 1402/ Saipa engine lights up the stock market?

According to Tejarat News, past experience shows that car manufacturers always play an important role in creating and ending trends in the stock market. Therefore, the technical analysis of Khasapa as well as the index of the automobile group is important in order to have an idea of possible scenarios regarding the possible path of this group.
Technical status of the automobile industry
Although the percentage growth rate of the Khasapa symbol has been almost similar compared to the growth of the automobile industry and parts manufacturers, the status of the chart of the two is slightly different. The index of this group has crossed its important resistance which was built during the stock market fluctuations during the fall of 2019 and has reached the pullback range with the recent correction process. A look at the price chart of the Khasapa symbol shows that after a short penetration to prices above the resistance, this symbol has entered the corrective phase.


However, the price chart of Khasapa symbol and the car group index have a very high correlation with each other and all their waves have started and ended at the same time. In this regard, it can be said that Khasapa’s price behavior is a bit more intense and volatile than the index of the automobile and parts group.
The point hidden in the index chart of the automobile group is the equal slope of the corrective trend lines of this index from long ago until now. So that if we draw a descending trend line for the previous corrective trends, the slope of all of them is equal. Therefore, a line with the same specific slope can be drawn from the historical ceiling of the auto group index, and its failure can be considered as the start of a sharp upward movement.

Also, for those who intend to make long-term investments in automobile stocks or parts makers, this group’s index pullback provides a low-risk purchase opportunity in terms of price and time after the failure. Because in addition to the amount of risk on capital, in inflation conditions, the risk of capital sleep is also an important factor that investors consider when entering a market.
Regarding the goals of this index, we can also consider the previous ceiling ranges as the first goal, double the depth of the cup pattern that happened in the chart (range of 745 thousand units), the second goal, and finally the levels of 1.618 and above, the Fibonacci regression tool drawn on the rising wave and Considered the previous correction as the next goal.
Khasapa technical analysis
In the previous report that was published in April of this year on the Tejarat News website, a price target of 338 Tomans was mentioned for Khasapa. After the share price of Saipa Company continued its trend with a small correction after achieving this target, it finally entered its correction process 15% above the mentioned range.
Examining the behavior of the stock price of this symbol in the recent upward trend that started in November of last year, shows that the correction lags are not limited to the correction to the support of the previous ceiling, and it ends after penetrating to prices lower than this range.
Currently, according to the wave count of the upward trend, the cycle of five waves has been completed in the upward trend and there is a possibility of disrupting this principle. Therefore, Saipa shareholders should be prepared for this scenario as well.

In this case, two return ranges can be mentioned for Khasapa. First, one and a half times the size of the previous correction, which shows the range of 240 to 245 Tomans. If the price reaches the mentioned range with an increase in the volume and value of transactions, buying Khasapa shares is a low-risk option on the investors’ table.
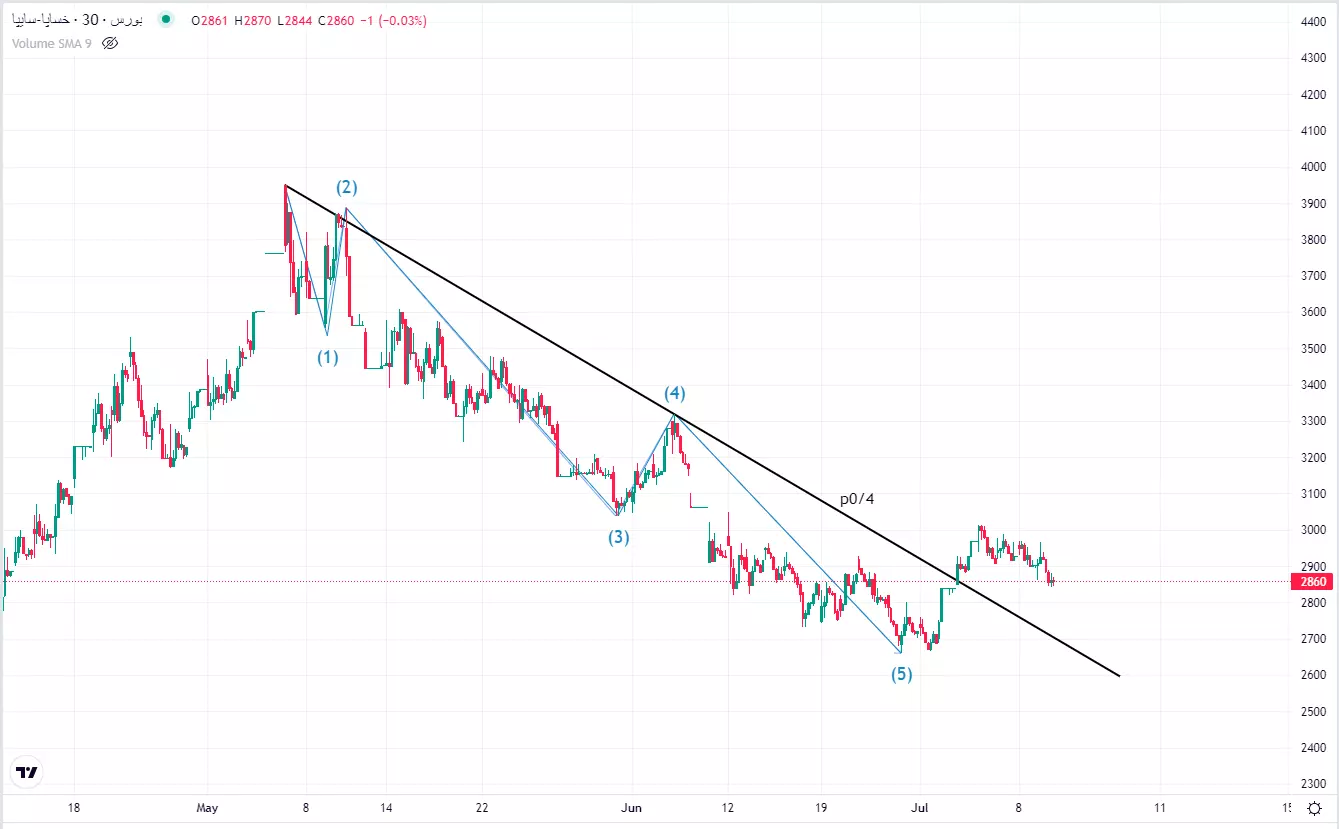
Another scenario is the continuation of the upward trend with the same rule as before. Currently, the price has reached the drawn middle line by repeating the size of the previous correction. On the other hand, the P0/4 line of the corrective trend is also broken. Therefore, if there is a noticeable change in Khasapa’s liquidity inflow, we can expect Khasapa’s movement from these current limits.
The beginning of the next upward lag in the current conditions of the stock market will be in two ways; The first mode is floor formation in the form of a suffering trend and then the beginning of the next leg of the ascent and the second mode is the arrival of heavy liquidity and moving with the buying queue. In large stocks and indexing such as steel, Shasta and automobile manufacturers, etc., the first case is more likely.
In relation to the price target of the “Khasapa” symbol, it is also possible to consider reaching the ceiling of the doubled channel that was drawn for it earlier. Finally, crossing the historical ceiling of the summer of 1999 is the higher target of Khasapa’s price.
Read more reports on the stock news page.