Technical analysis of Pars October 1402 / Buyers are waiting for the opportunity to enter! – Tejarat News
According to Tejarat News, Pars Petrochemical Company can be traded on the first market of the stock exchange under the symbol “Pars”. Zagros shares with a market value of 131 thousand 817 billion tomans are in the chemical products group.
The analysis of “Pars” trading board shows that the price behavior of this share takes place with a short break in the direction of suspicious legal movements of the share. Therefore, whenever the rights start to buy heavily, a little later, the share of floor swings made in its chart has given good returns to the shareholders. Therefore, in order to recognize the validity of the upward wave, it is very important to examine the legal behavior of the share.
Technical analysis of chemical index
In the weekly dimensions, identifying the major structure in the chemical group index chart helps a lot to identify the trend. After the deep reform of this industry, which occurred simultaneously with the collapse of the market in 1999, a new trend started in the chemical group in the middle of March of the same year. The structures specified in the index chart of this industry indicate that the index of this group is bullish.


Also, the emerging structures show that the corrective waves of the mentioned trend are very similar to each other. So that this index ended during the recent correction of the market from the middle of May of this year as soon as it reached the size of the previous correction, and the index of the chemical group started building higher ceilings and floors.
The pattern of the Andrews fork tool in the pullback style shows that this indicator measured the level of support of the buyers by testing and then re-testing the middle line, and after that it was thrown upwards. If the last floor is maintained in the range of 152 thousand units, the indicator of the group of chemical symbols has the target of reaching the ceiling of the Andrews fork.
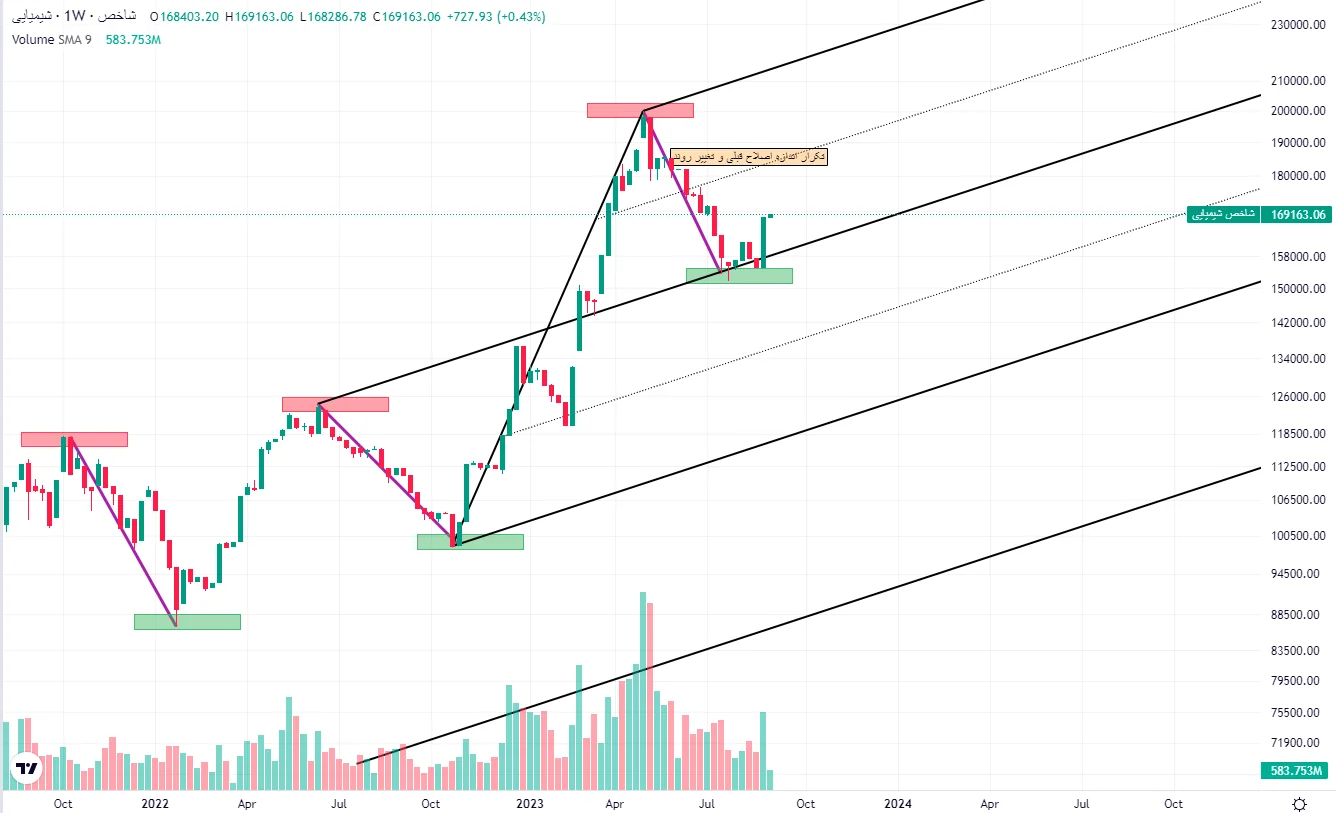
Therefore, it can be claimed that the three previous reform waves are from the same family. On the other hand, the slope of the first wave of this upward trend is very similar to the last upward wave of the market, which began in November 1401. Therefore, this point can be used to draw the Andrews fork.
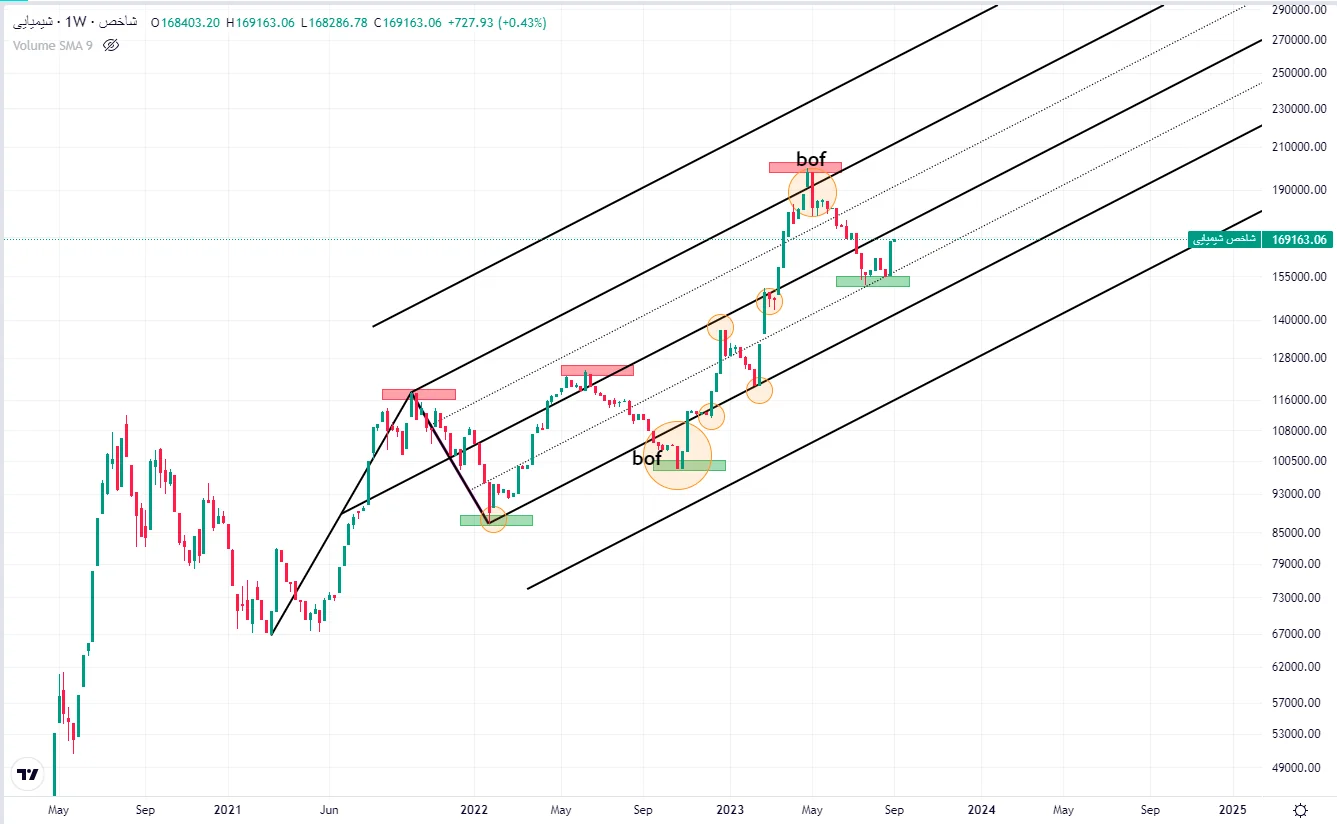
Based on this drawing, if the weekly candle of this indicator closes above the middle line, it has a great chance for the index to grow to a high parallel. This means that the index has crossed its previous ceiling.
Technical analysis of Pars shares
Determining the structure in the Pars stock price chart shows the upward trend of this symbol. In the weekly timeframe, the price has started an upward rally after going through a period (Tir 99 to Tir 1400) of accumulating spring energy in the energy coil. In continuation of the trending movement of the Pars stock price, it has continued until now and the share has gone through several upward and corrective waves. Currently, “Pars” is in one of its correction waves. But the question of Pars shareholders is where is the end point of the correction wave?
Using majori re-action in the Pars stock price chart to draw tools is a reasonable choice. In fact, by projecting the biggest re-action of the trend, we will find a map for the price path. Sliding parallels (sliding parallels) drawn well indicate the dance of the price in the frequency of the instrument used.
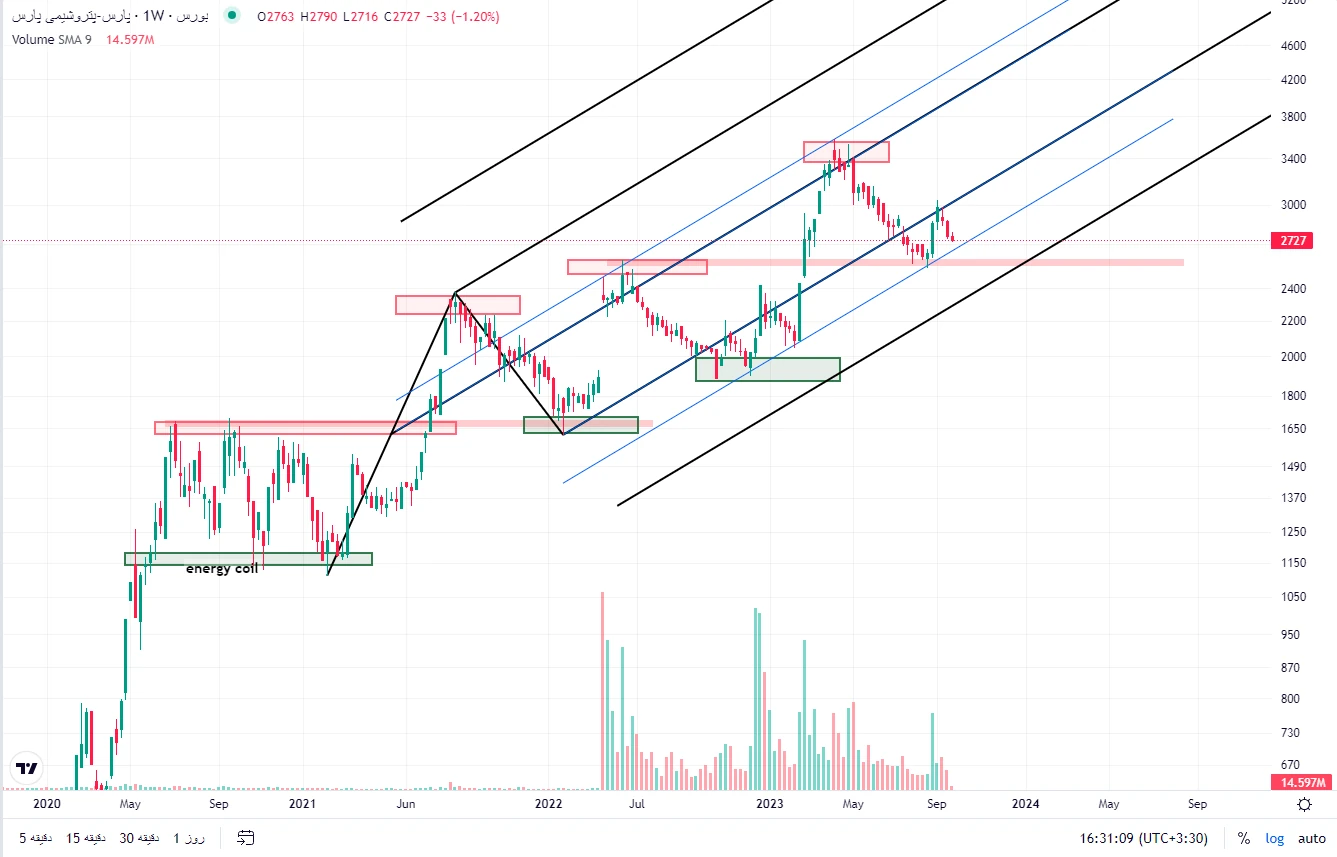
At the moment, the re-interaction of the price with the parallel sliding drawn from the lower MLH of the fork, along with the red static range (254 to 259 Tomans), has a high chance to end the corrective trend.
If the price returns from this range, the historical ceiling of 353 Tomans is the first target of this symbol. After touching the upper parallel sliding line, this is where the profit saving point of some shareholders can be placed.
disclaimer: All contents included in this site are research, scientific and news and are not recommended for direct activity in any market.
Read more market analysis reports on the Capital Markets page.