Technical analysis of Shakbir stock in October 1402 / Amirkabir Petrochemical on the threshold of a new trend
According to Tejarat News, Amirkabir Petrochemical Company can be traded in the over-the-counter base market with the symbol “Shakbir”. Shakbir shares with a market value of 26 thousand 298 billion tomans are in the chemical products group.
The analysis of “Shakbir” trading board shows that the price behavior of this share takes place with a short break in the direction of suspicious legal movements of the share. Therefore, whenever the right has started to buy heavily, a little later, the share of floor swings made in its chart has given good returns to the shareholders. Therefore, in order to recognize the validity of the upward wave, it is very important to examine the legal behavior of the share.
Technical analysis of chemical index
In the weekly dimensions, identifying the major structure in the chemical group index chart helps a lot to identify the trend. After the deep reform of this industry, which occurred at the same time as the market collapse in 1999, a new trend started in the chemical group in the middle of March of the same year. The structures specified in the index chart of this industry indicate that the index of this group is bullish.


Also, the emerging structures show that the corrective waves of the mentioned trend are very similar to each other. So that this index ended during the recent correction of the market from the middle of May of this year as soon as it reached the size of the previous correction, and the index of the chemical group started building higher ceilings and floors.
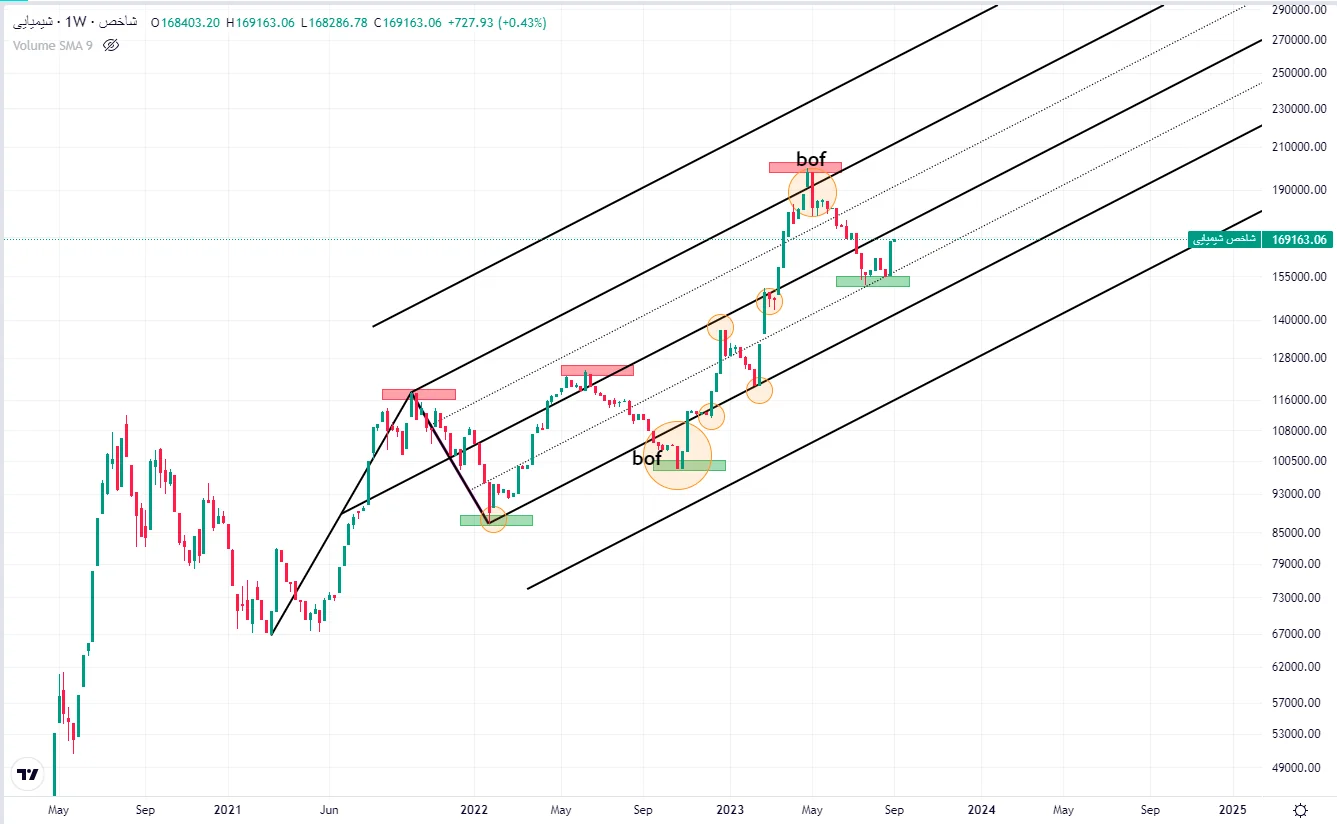
The drawing of the Andrews fork tool in the pullback style shows that this indicator measured the level of support of the buyers by testing and then re-testing the middle line, and after that it was thrown upwards. If the last floor is maintained in the range of 152 thousand units, the indicator of the group of chemical symbols has the target of reaching the ceiling of the Andrews fork.
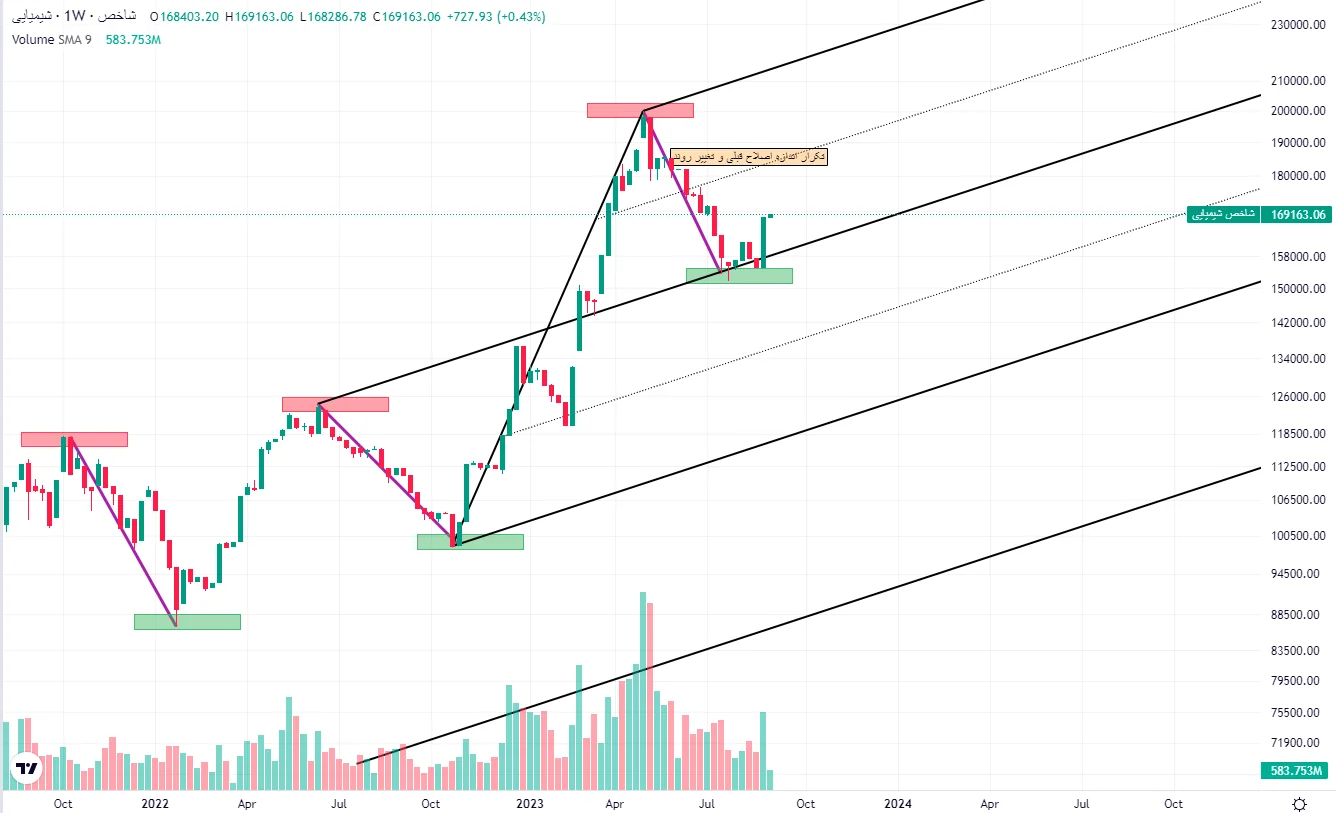
Therefore, it can be claimed that the three previous reform waves are from the same family. On the other hand, the slope of the first wave of this upward trend is very similar to the last upward wave of the market that started in November 1401. Therefore, this point can be used to draw the Andrews fork.
Based on this drawing, if the weekly candle of this indicator closes above the middle line, it has a great chance for the index to grow to a high parallel. This means that the index has crossed its previous ceiling.
Technical analysis of Shakbir stock
In the technical analysis of Shakbir’s stock, the mpl line (blue line) can be used as the basis for subsequent drawings and to get an initial idea about the possible path of price movement in the future.
The drawn mpl is well accepted by the price. Using the Fibonacci Manal tool (integer and equal number intervals) and projecting Amirkabir Petrochemical corrective movement channel into the future gives good dynamic levels.

On the other hand, drawing an ABC-style Andrews fork (using the three pivots at the end of the corrective wave) next to the MPL line gives very important intersections, which we call energy points. The previous energy point at the level of 9,773 Tomans, with a good approximation, announced the end of the upward phase of the market to the traders; Therefore, it can be expected that the next energy point, which is around the price of 7,320 Tomans, will be the end point of the correction process.
On the other hand, the price is on the balance and 61.8% Fibonacci retracement, which has increased the chance of a rotation in Shakbir’s chart. In this analytical scenario, the first share target, the blue box, is the result of the intersection of the middle line and the first level of the Fibonacci channel. This range shows the price of 9,365 Tomans. In the following, the previous ceiling and the upper parallel of the middle line can be considered as a higher target.
disclaimer: All contents included in this site are research, scientific and news and are not recommended for direct activity in any market.
Read more market analysis reports on the Capital Markets page.