Technical analysis of the accumulation index / inverse top pattern is the basis for the rise?

According to Tejarat News, at the beginning of this week, the Statistics Center of Iran, in a separate report, published the data on the development of the housing sector in September 1402. This was despite the fact that since December of last year until now, the Central Bank and the Statistics Center had not published any clear data on developments in the housing sector, and the publication of housing statistics was limited only to the general inflation reports published by the Statistics Center.
According to this report, the annual inflation rate of September 1402 in the residential apartments sector of Tehran has reached 83.9%, which has increased by 1.9 percentage points compared to the same information in the previous month (82%). In response to this published report, the shares of Massification Group experienced a uniform market map in the first days of the week. However, what is the view of technicalists regarding the condition of the index chart of this group?
Technical analysis of accumulation index
The upward trend of the stock market started in November last year. The symbols of the mass production industry were not excluded from this trend. The upward rally of the market continued until the middle of May. Currently, after 23 weeks of correction, the index of the accumulation group has shown some openings of hope to change the trend in its chart.


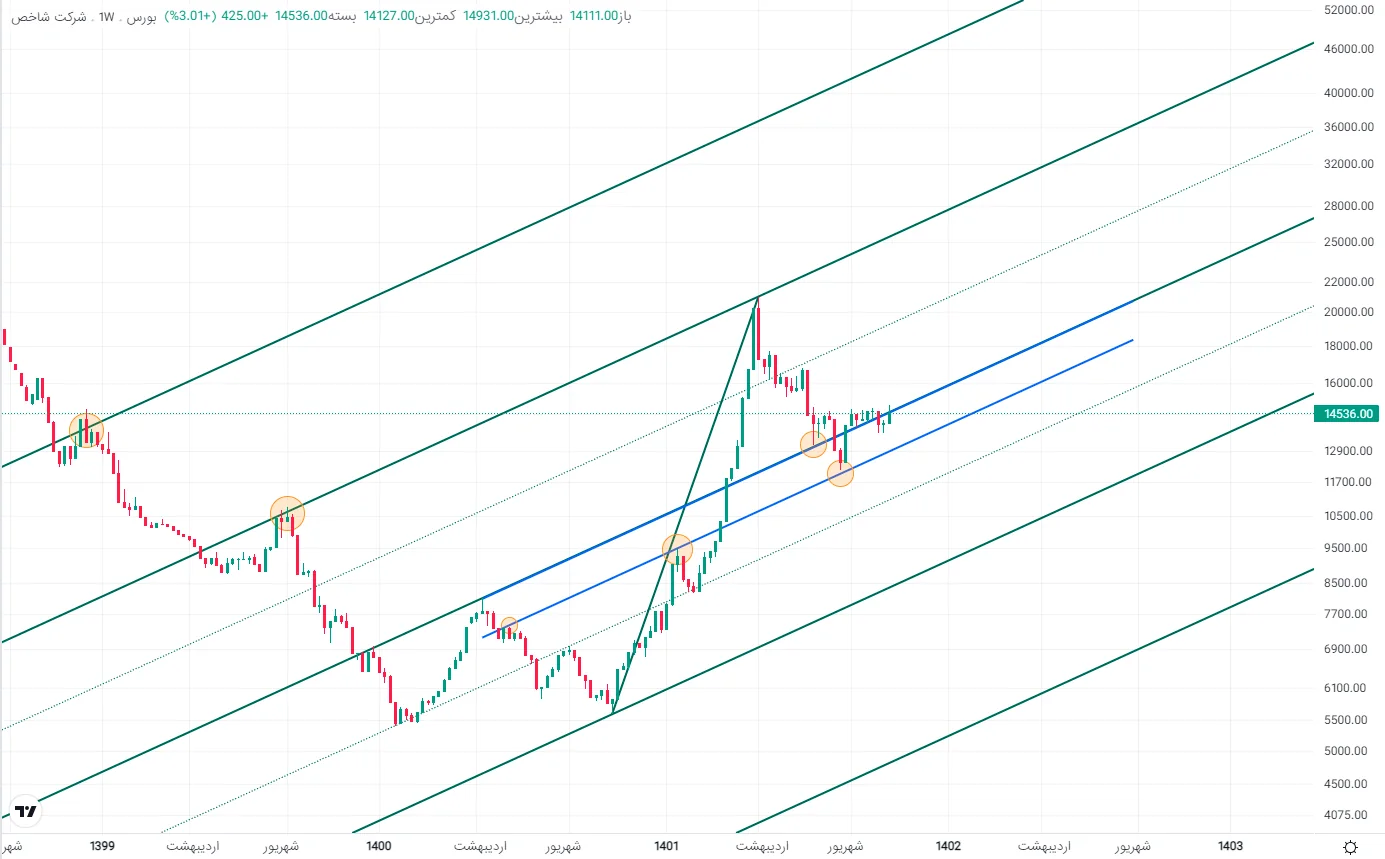
The technical analysis of the chart of the accumulation group index, in the weekly dimension, shows that the dominant trend of the share is still upward. Although the index’s previous rally was unable to cross its historical ceiling in the range of 21,268 units, it crossed all the ceiling swings confirmed by the fall of 1999.
This indicator was able to cross the resistance range of 14 thousand 649 to 14 thousand 828 units in the candle on the first day of November, which is indicated by the red box in the image below. This range is the last approved ceiling of the correction process. In fact, passing through it, the index issues a very important sign of changing its behavior.
The crossing of the group of mass builders through this range required stabilization, which has not been achieved until now. Even the return of the index below this range, which happened in today’s candle, provides the risk of reducing the height of the index at least to the range of 13,905 units.
The chart of Mass Makers in the weekly timeframe shows that this indicator has well accepted the frequency of the Andrews fork. The way the indicator behaves with the Andrews fork lines conveys this importance. The return and stabilization of this index above the middle line is necessary in order to reach the upper parallel of the fork. Currently, as checked in the daily timeframe, the price crossing the mentioned range fulfills both the conditions of the bullish scenario, i.e. the sign of a change in behavior and placement above the drawn middle line.
Technical similarity with the status of the index in 1993
A deep examination of the aggregation index chart reveals an important secret of this chart. The technical path taken since the beginning of the fall in 1999 until now has a lot of similarities with the process taken by the accumulation index during 1993 and 1994.
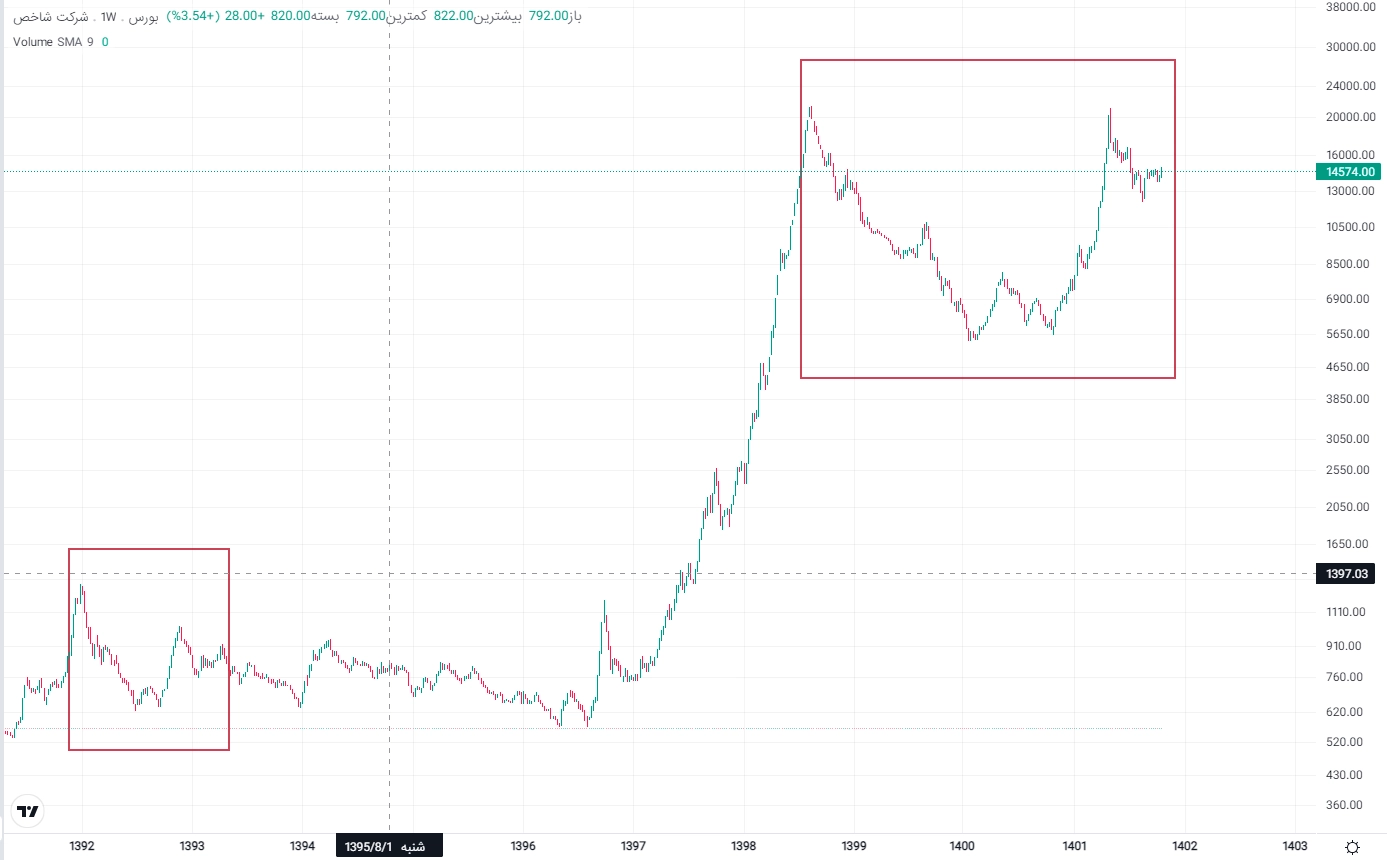
The behavior of the indicator has been repeated step by step with a suitable estimate. This issue refers the people of the capital market to the first principle of technical analysis, which is the repetition of the past. Although the current conditions of the stock market are very different from the conditions of 1993 and 1994, we can get the idea of a pessimistic scenario from the similarity in the behavior of the accumulation indicator.
In the last decade, after the fall of 1992, despite the start of upward rallies, this index failed to cross the historical ceiling of that time for a long time. In this pessimistic scenario, it can be claimed that the compression of this indicator will continue, and for the start of long-term ascent and crossing of the historical ceiling, we still have to wait.
Disclaimer: All contents included in this site are research, scientific and news and are not recommended for direct activity in any market.
Read more market analysis reports on the Capital Markets page.