Technical analysis of the car in July 1402 / Is the end of the reform of car manufacturers coming?

According to Tejarat News, the symbol of the car and the car industry in general has a high potential for directing and leading the stock market. Therefore, it is very important for traders to know the road ahead of the country’s automobile giant.
“Khodro” symbol, which is the main representative of automobiles, managed to get 158% return for its shareholders in seven months after the beginning of the upward phase of the stock market in November of last year.
Currently, the main activity of Iran Khodro is the production of body parts, engines, production and assembly of passenger cars and vans. The shares of this company are currently traded in the second market of the stock exchange and in the automobile and parts manufacturing group. Iran Khodro is the largest company of this group with a market value of about 95 thousand 293 billion tomans.


Technical status of the automobile industry
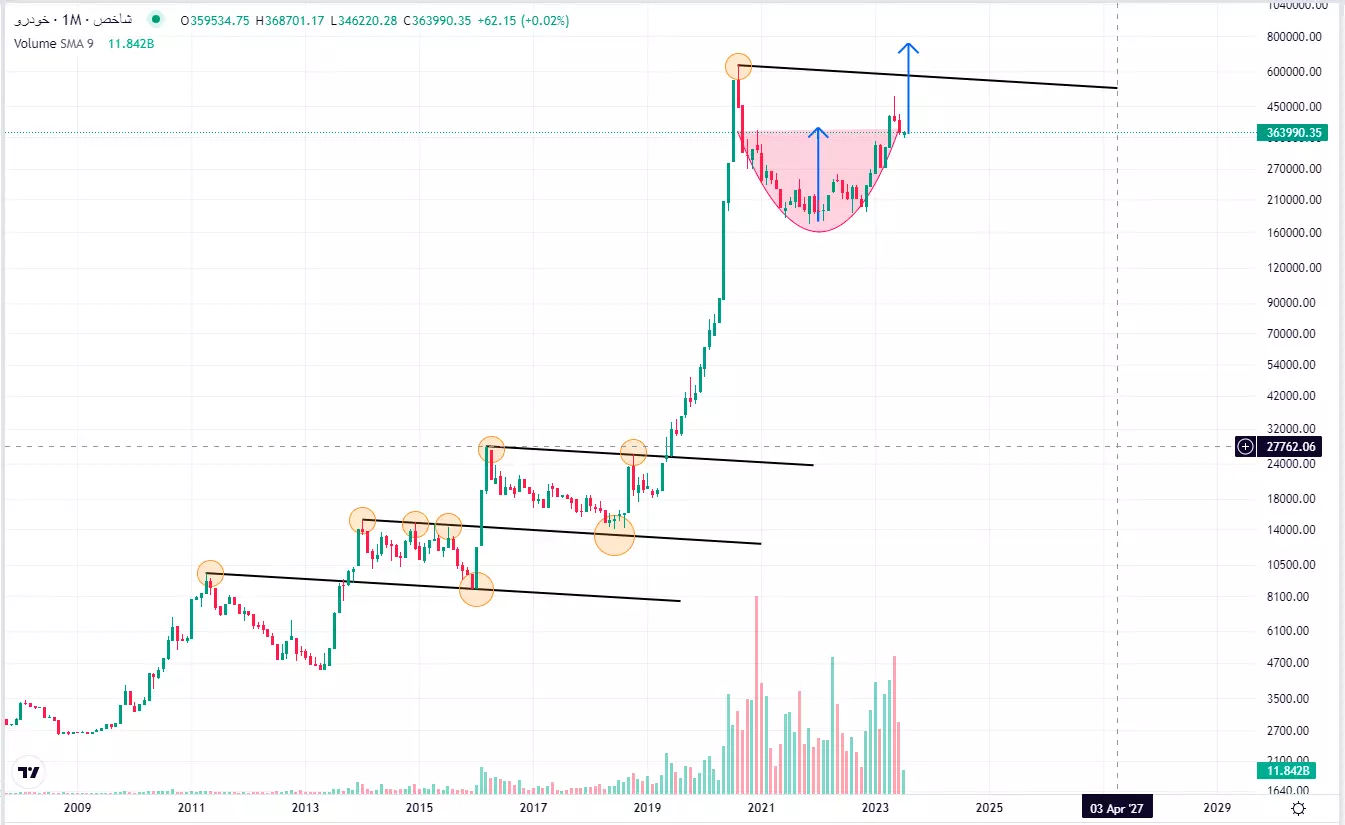
Although the percentage growth rate of the automobile symbol has been almost similar compared to the growth index of the automobile industry and parts manufacturers, the chart status of the two is seriously different. While the index of this group has crossed its important resistance which was built during the stock market fluctuations in the fall of 1999 and has reached the pullback range with the recent corrective trend, a look at the price chart of the car symbol shows that the price collision With the resistance range, this symbol has moved into a corrective phase.
However, the price chart of the car symbol and the car group index have a very high correlation with each other and all their waves have started and ended at the same time.
The point hidden in the index chart of the automobile group is the equal slope of the corrective trend lines of this index from long ago until now. So that if we draw a descending trend line for the previous corrective trends, the slope of all of them is equal. Therefore, a line with the same specific slope can be drawn from the historical ceiling of the auto group index, and its failure can be considered as the start of a sharp upward movement.
Also, for those who intend to make long-term investments in automobile stocks or parts makers, this group’s index pullback provides a low-risk purchase opportunity in terms of price and time after the failure. Because in addition to the amount of risk on capital, in inflation conditions, the risk of capital sleep is also an important factor that investors consider when entering a market.
Regarding the goals of this index, we can also consider the previous ceiling ranges as the first goal, double the depth of the cup pattern that happened in the chart (range of 745 thousand units), the second goal, and finally the levels of 1.618 and above, the Fibonacci regression tool drawn on the rising wave and Considered the previous correction as the next goal.
Technical analysis of the car
The upward trend of the car share, which started in November of last year, happened in the form of 5 waves until the middle of May. In the meantime, the second and fourth waves, both of which have a corrective nature, were largely equal, and the end of the fourth wave gave a good buying opportunity to the people of the stock market.
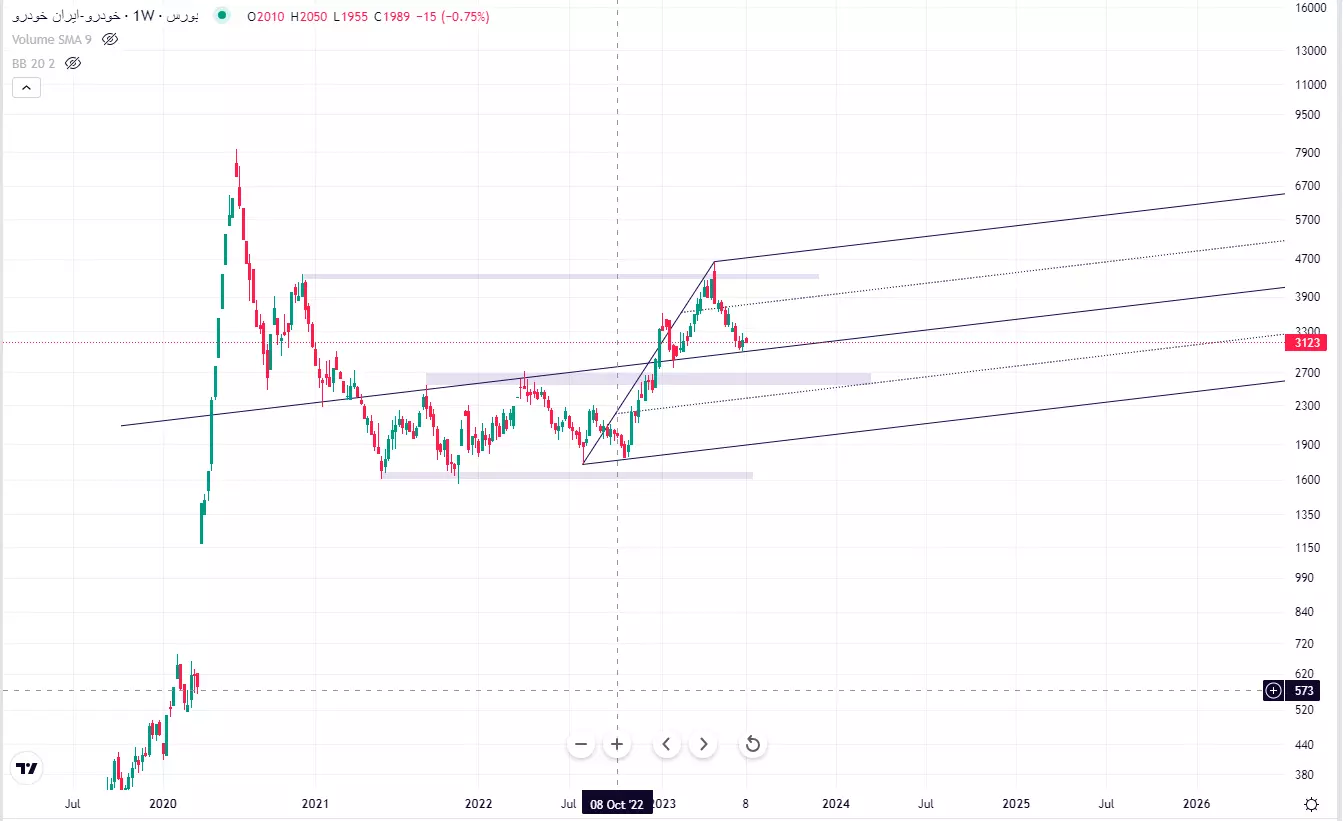
Currently, the size of the correction has exceeded the size of waves two and four. The Andrews fork drawn on the car stock price chart can show the road map to the shareholders. The approach of the car price to the middle line of the drawn fork indicates that we are nearing the end of the correction process.
However, the other scenario still has a chance. This scenario states that price penetrates below the midline and starts its trend by activating stop loss orders. In order to confirm the start of the share movement, it is necessary to track the arrival of cash flow to the share.
Read more market analysis reports on the stock market news page.