The possibility of another wave of sales in the bitcoin market; What do in-chain data say?

Some bitcoin investors think the digital currency, which now fluctuates around $ 30,000, has reached its bottom; But intra-chain data show that the final wave of bitcoin sales has not yet arrived.
To Report Kevin Telegraph The upward trend in the digital currency market in 2021, which took most digital currencies to new heights, has been replaced by a downtrend. Currently, not all traders who have purchased their bitcoins since January 1, 2021 (December 12, 1999) are in good shape. Glassnode data shows that these bitcoin investors are now at a loss, and the digital currency market is preparing for the latest wave of traders selling.
Unrealized Profit or Loss Chart (NUPL) Bitcoin measures the total profit and loss of units in circulation of this digital currency. As you can see in the chart above, this indicator shows that now less than 25% of the total bitcoins in profit are; That is, they were purchased at a lower price than the current price. The current state of the Bitcoin market is the same as when the digital currency was preparing for a big sell-off in previous declining markets.
If the bitcoin trend is the same as before, based on the sell-offs of this digital currency in previous downtrends, it can be said that its price may reach $ 20,560 to $ 25,700. This will happen when there is a full-fledged sale in the bitcoin market.
The market is looking for its price floor
Given that the digital currency market is clearly in a downturn, the question that has occupied the minds of all traders is where is the price floor of this downturn?
One indicator that can help us find the answer to this question is the Mayer Multiple coefficient, which compares the current price of bitcoin to its 200-day moving average.
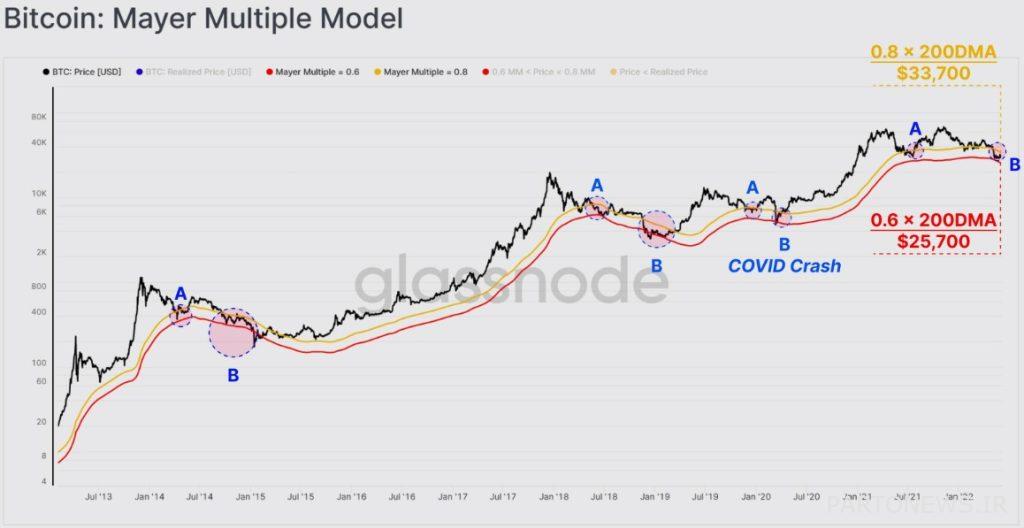
According to data from the Golsnood site, during previous downtrends, when the market entered a saturation phase or the price fell too much, the Mayer coefficient ranged from 0.6 to 0.8. This is exactly the range in which Bitcoin is currently located.
Based on the Bitcoin price performance in the previous downtrends, it can be said that the recent Bitcoin trading range ($ 25,200 to $ 33,700) corresponds to the second phase (B) of the previous cycles shown in the chart above. This could indicate that Bitcoin is nearing the bottom of its current cycle.
The Realized Price Model of this digital currency can also be useful to find the potential price floor of Bitcoin. LookIntoBitcoin data show that the realized price of Bitcoin as of June 5 (June 15) was $ 23,601.
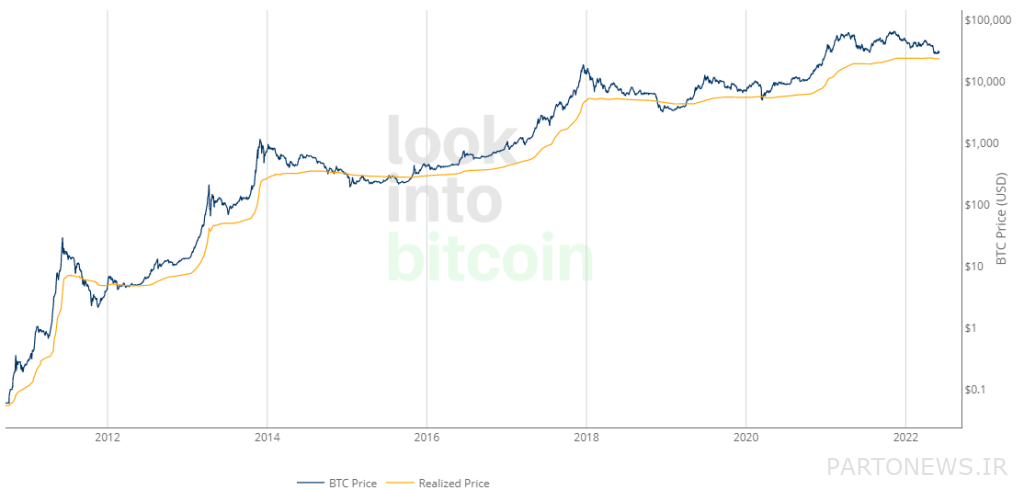
Based on these two indicators, it can be concluded that the bitcoin floor is probably somewhere between $ 23,600 and $ 25,200.
Sales wave of short-term holders and miners
The current market sales pressure is largely related to short-term holders. Short-term holders in the previous two downtrends showed the same behavior. Long-term holders accounted for more than 90 percent of market supply profits at the time. Supply in profit refers to units that have been purchased at a price lower than the current market price.
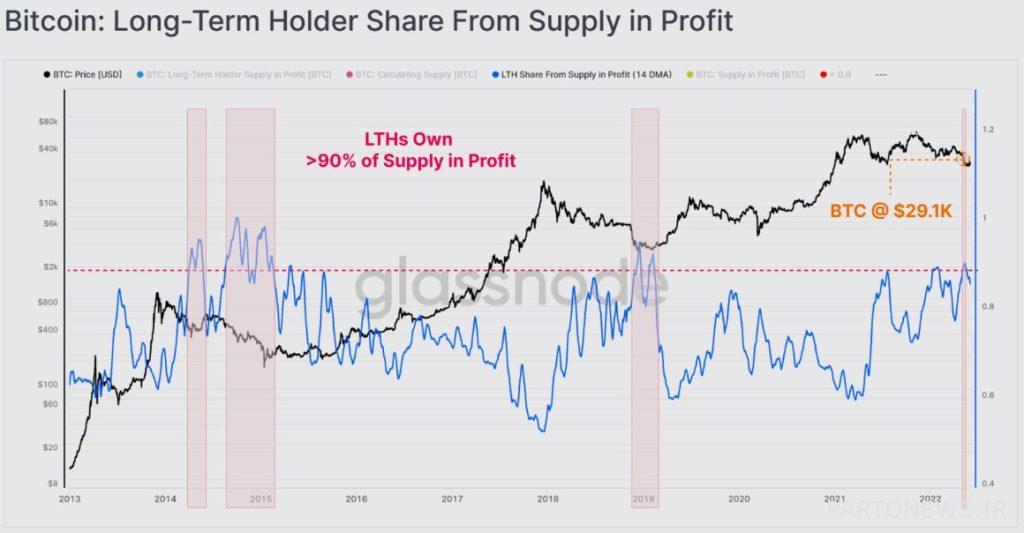
The recent fall of bitcoin below the $ 30,000 mark has pushed long-term holders’ share of profitable bitcoins to over 90 percent. This indicates that short-term holders are probably now approaching the loss threshold they can bear.
Miners have also been selling more net worth in recent months than buying bitcoins, according to Golsnood. The reason is that the decrease in the price of this digital currency has made their income less than before. That’s why miners’ total inventory has recently dropped by an average of 5,000 to 8,000 bitcoins per month.
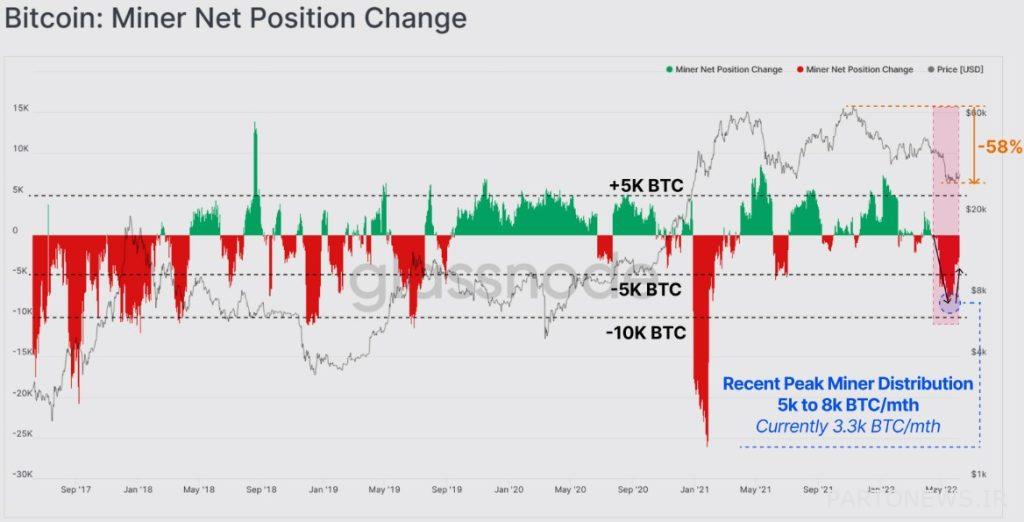
If the price of bitcoin falls again, miners may join the wave of sales in the market. It should be noted that the Puell Multiple coefficient also confirms this issue. The Poole coefficient actually measures the ratio of the dollar value of the bitcoins mined per day to the moving average of 365 daily value of these bitcoins.
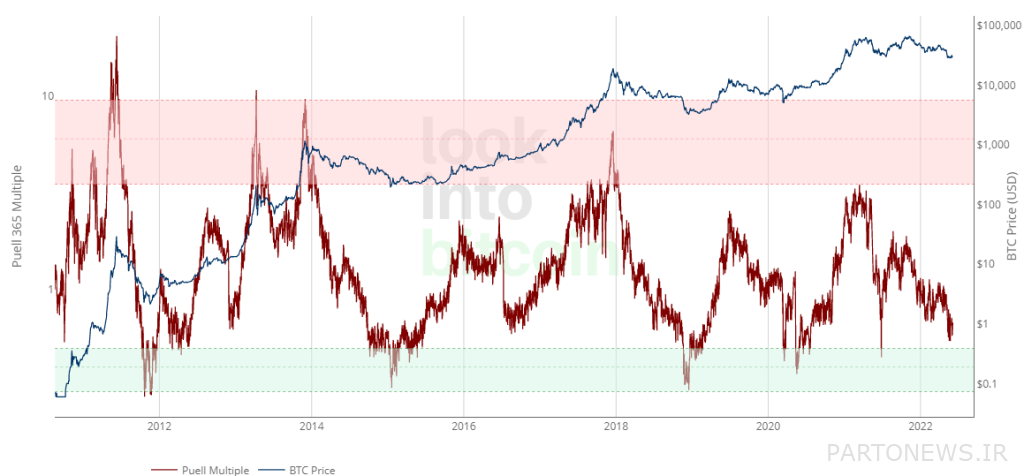
History has shown that the Poole coefficient falls below the level of 0.5 in the final stages of declining markets. It is worth mentioning that the bitcoin pole coefficient in its current cycle has not yet reached the mentioned area. In general, if the price of Bitcoin falls another 10%, the miners will create their final sales wave. These conditions are exactly the same as the price declines and sell-offs of previous Bitcoin downtrends.

