Uptrends in the Bitcoin and Altcoin market; Five digital currencies that traders should be watching this week

Bitcoin’s dominance rate, which was around 48% on October 20, fell to 42% yesterday. However, the overall value of the digital currency market continues to rise, indicating that the uptrend has shifted from bitcoin to the coin market for some time.
CryptoQuant CEO Ki Young Ju says Bitcoin whales are selling some of their assets, but that has not broken strong $ 60,000 support so far. He also said that the bitcoin stock of digital currency exchanges is still declining, and this could be a sign of buyers’ activity.
A recent poll by PlanB, creator of the S2F accumulation model, on Twitter shows that most investors are bullish on bitcoin and expect it to rise in price by the beginning of 2020. Start at $ 288,000.
Raoul Pal, co-founder of Real Vision, also shared his upward view of the digital currency market during his November 3 conversation. In his opinion, the current uptrend is unlikely to end in December this year. Paul is waiting for the completion of the Atrium network upgrade to the second version, and predicts that the approval of the Atrium Stock Exchange (ETF) in the first half of 2022 will attract institutional investors and increase the price of this digital currency next year.
In the continuation of this article, we will examine the situation of the price chart of 5 currencies, which can have acceptable performance in the short run.
Bitcoin (BTC)
The price of Bitcoin crossed the resistance of the rising flag pattern on November 2 (November 11), but buyers were not able to push the price above the resistance in the range between $ 64,854 and $ 67,000. This shows that the sellers have not yet given up and are trying to prevent the price from continuing to move upwards.
On the plus side, buyers have so far strongly defended the 20-day moving average (EMA) support at $ 60,794 and will have to try once again to push the price above the resistance area.
If buyers continue to cross the $ 67,000 resistance, the price may accelerate, and it is likely to reach the target of the $ 89,476 flag pattern.
But if the price falls and returns below the uptrend line of the flag pattern, the credibility of this bullish outlook will also be lost. Continuation of the downtrend may be accompanied by a fall in the 50-day moving average (SMA) at $ 54,883. In such a situation, buyers are likely to support the price in the range between the simple 50-day moving average and the level of $ 52,920.
Also read: How to use simple moving average and exponential for trading?
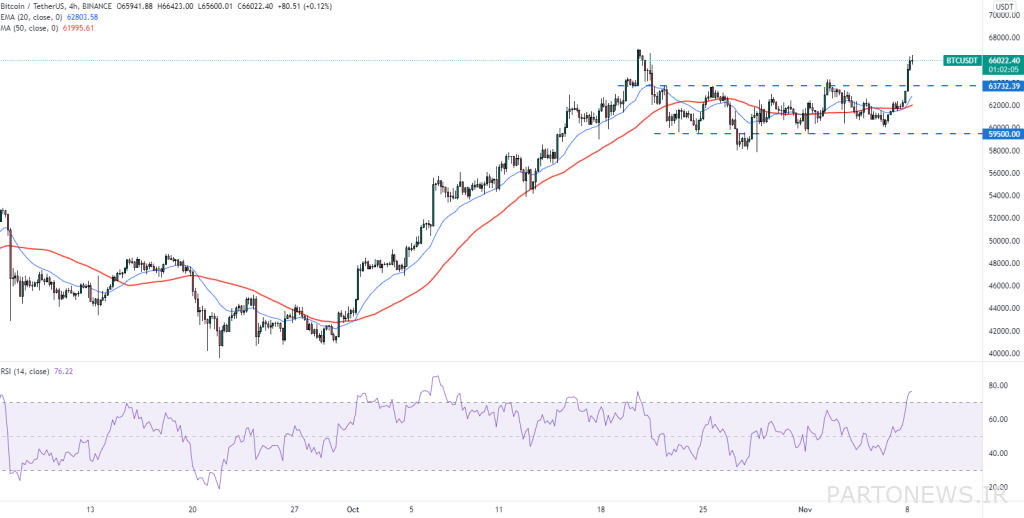
In the 4-hour market view, the price candle is back above the moving averages and buyers have raised the price above the resistance levels of $ 63,732 and $ 64,270, so in this view, too, a new historical peak is likely to be reached.
Polkadat (DOT)
Polkadat started an uptrend on November 1 (November 10) and was able to overcome the resistance of $ 49.78. The relative strength index also cut the downward trend line and with this move, the credibility of the downward divergence was lost. This may be a sign that the uptrend is continuing.
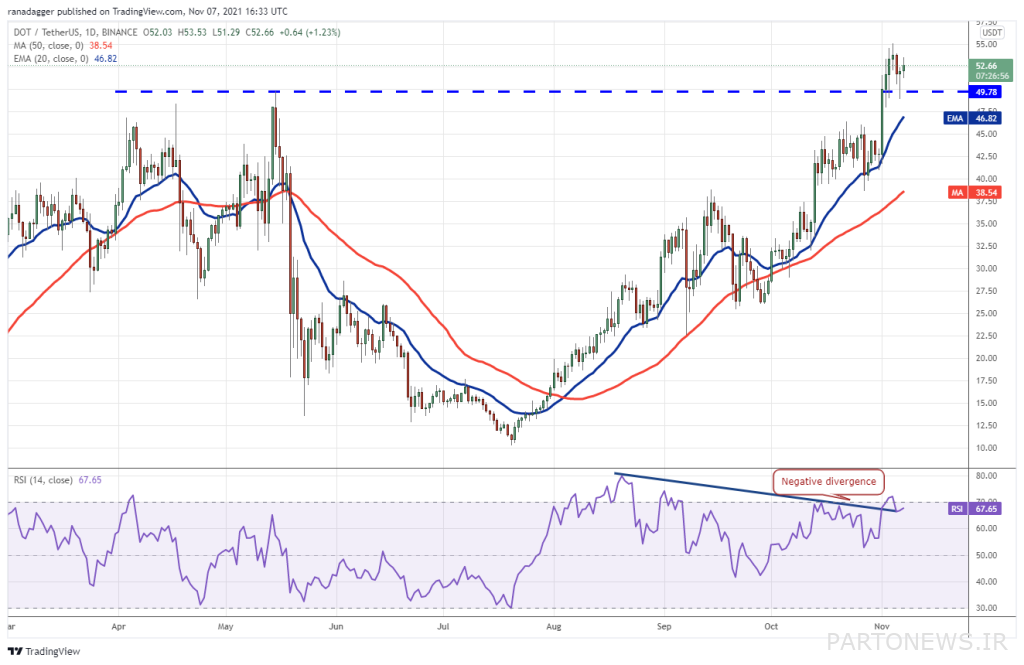
Sellers tried to bring the price below the previous broken level of $ 49.78 on November 6, but the long shadow of the 1-day candlesticks shows that buyers are accumulating on the recent price floor. The ascending slope of the moving averages and the placement of the relative strength index near the buy saturation range indicate that the price is facing the lowest resistance as the uptrend continues.
If buyers can push the price above $ 55.09, the way will be paved for $ 63.08. Sellers may continue to try to push the price below the $ 49.78 breakout level; Such a move may indicate the weakness of buyers.
Breaking the daily candle below the 20-day moving average can be the first sign that buyers are losing control of the market. After that, the price will fall to the level of a simple 50-day moving average at $ 38.54.
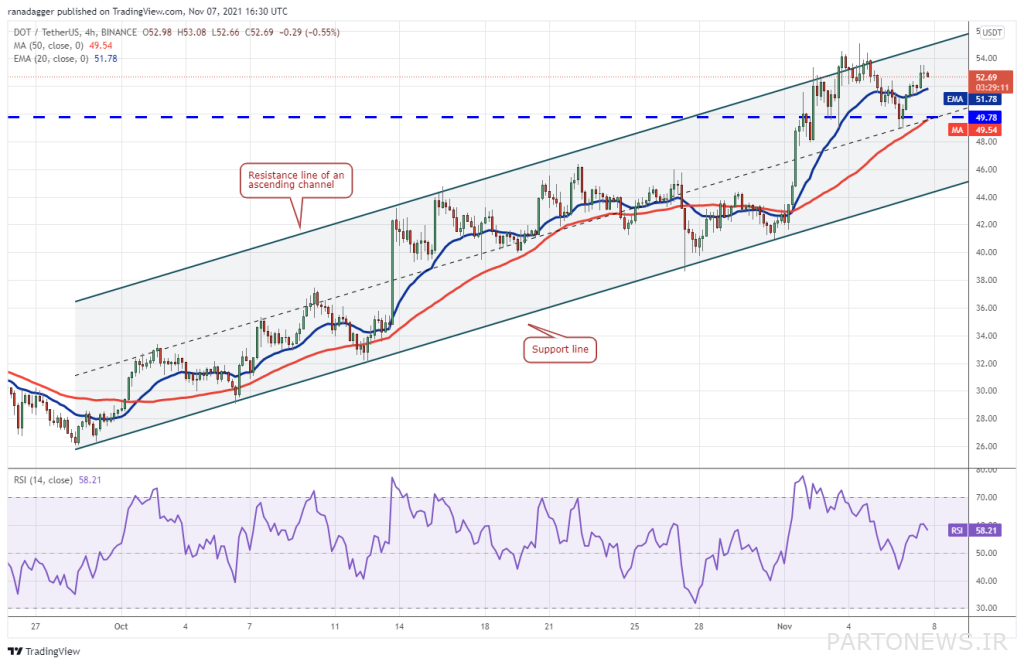
As can be seen from the 4-hour view of the market, the price is fluctuating in an uptrend channel. Buyers are likely to call everyone who looks appropriate, if there are only a few. This shows that the sellers are strongly defending the resistance of the canal roof.
The price candle has just returned to the upside after hitting the center axis of the uptrend channel, and buyers will have to keep trying to overcome the resistance of the channel ceiling. If they succeed in crossing this level, the upward acceleration of prices is likely to increase.
On the other hand, if the price returns below the mid-axis from the current levels or after hitting the resistance of the channel ceiling, the price may fall to the support of the channel floor. A return from this level can maintain the credibility of the uptrend, but breaking it is a sign that the market trend is changing.
Luna (LUNA)
Luna, the main token of the Terra protocol, passed the $ 49.54 resistance on November 4. Two days later, traders tried to push the price below the breakout level again, but could not maintain their position below the level of 49.54. This indicates that buyers are accumulating in recent price levels.
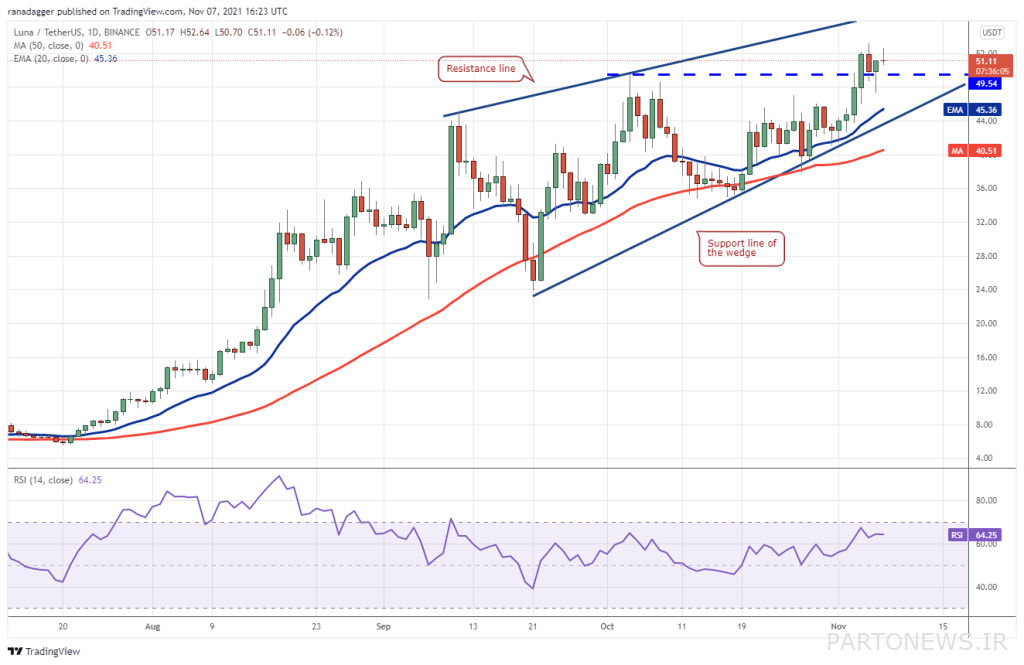
If buyers continue to push the price above $ 53.18, the way to reach the resistance of the uptrend pattern will be paved, where sellers will strongly resist the activity of buyers. If the uptrend continues and the price candle crosses the uptrend pattern, the uptrend is likely to increase.
On the other hand, if the price falls below current levels or after reaching the resistance of the uptrend pattern, the price may fall to support this pattern. The failure and closing of the daily candle below this level can be a sign of a change in market trends. After that, it will be possible to fall to the level of $ 35.
Also read: Familiarity with 10 technical analysis chart patterns that every trader should know
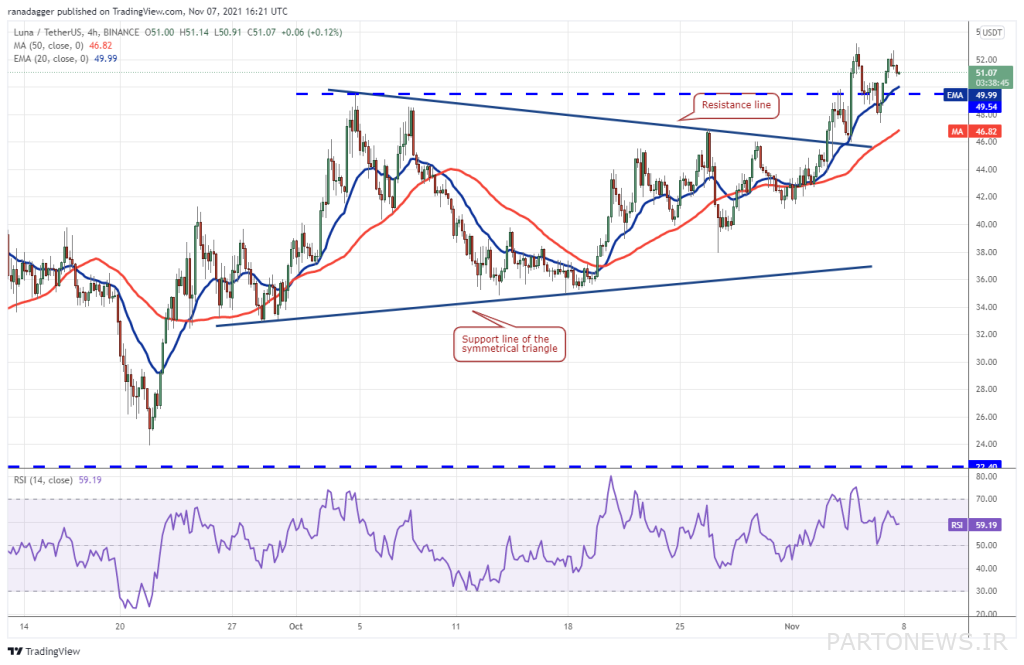
In the 4-hour market view, buyers have raised the price above the resistance of the triangle pattern, and this shows that they have overcome the sellers at this level. Sellers tried several times to push the price into the triangle pattern, but buyers strongly defended the breakout level of this pattern.
Both moving averages have an upward slope and the relative strength index is in the positive area, indicating the superiority of buyers. Like the 1-day view, if the price continues to cross $ 53.18, the way to reach the $ 62.59 target of the triangle pattern will be paved.
Ulnch (AVAX)
The Avalanche, after three days of trading near the $ 79.80 resistance, has now overcome this hurdle, and this could be a sign that the uptrend is resuming.
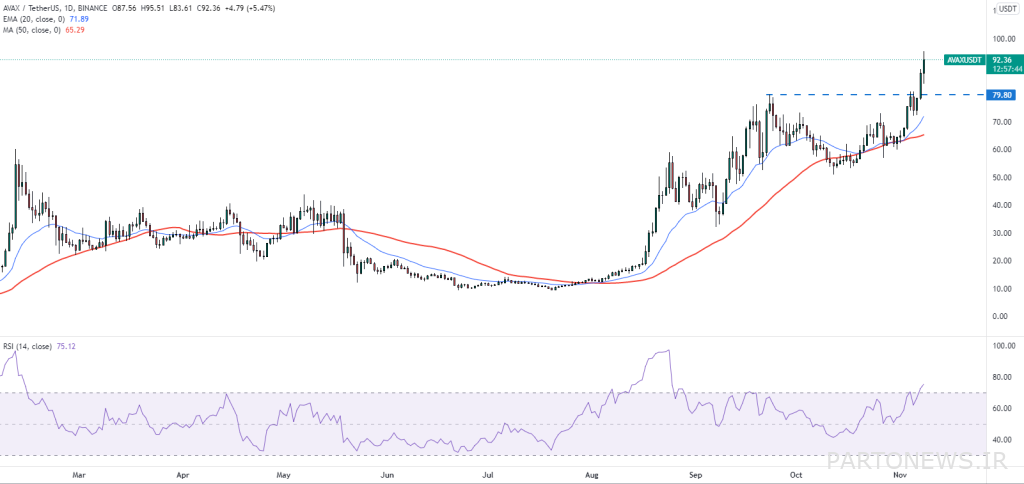
The upward slope of the moving averages and the entry of the relative strength index into the buying saturation zone show that buyers dominate the market. With the price staying above $ 79.80, the way has been paved for $ 93.04, and buyers will now try to break the $ 100 resistance.
But if the price continues to fall below the current level below $ 79.80, it means that the market is not ready to reach higher levels, and then we may see the price fall to the 20-day moving average at $ 69.51. .
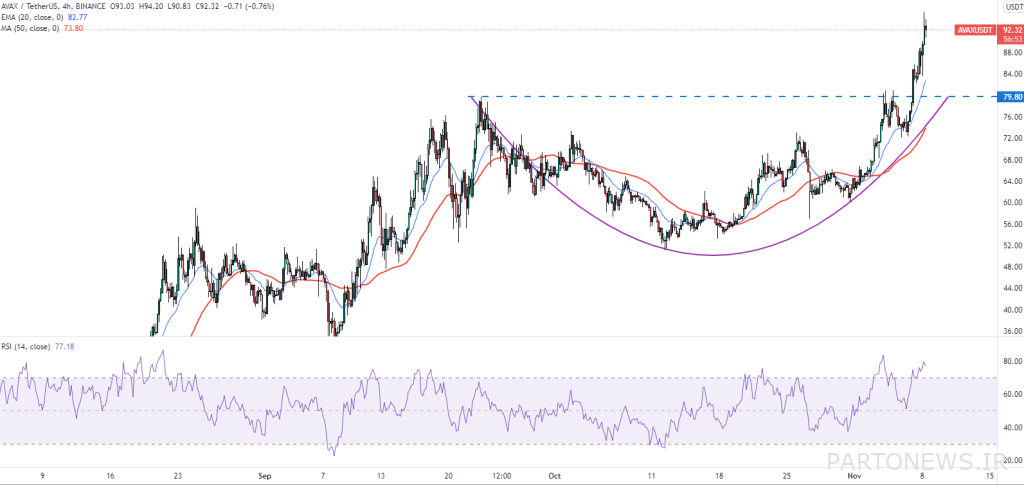
In the 4-hour view of the Olench market, a semicircular (rendering) pattern can be seen, which has been completed by breaking the price and crossing the $ 79.80 level. Given that buyers have been successful in maintaining their position above $ 79.80, the price can start its upward movement towards the target of this pattern at $ 108.56.
In the event of a downtrend, the first level to monitor is $ 79.80. Returning the price from this level means that buyers are accumulating oolongs on the price floor; A move that could increase the likelihood of a resumption of the uptrend.
On the other hand, a fall below $ 79.80 could push the Olench to $ 72. The breaking of the $ 72 support also means that the sellers have regained control of the market.
Elrond (EGLD)
Elrond crossed its previous high of $ 303.03 on November 3, which is a positive sign. The sellers tried to bring the price below the breakout level between November 5 and 6 (November 14 to 15), but failed.
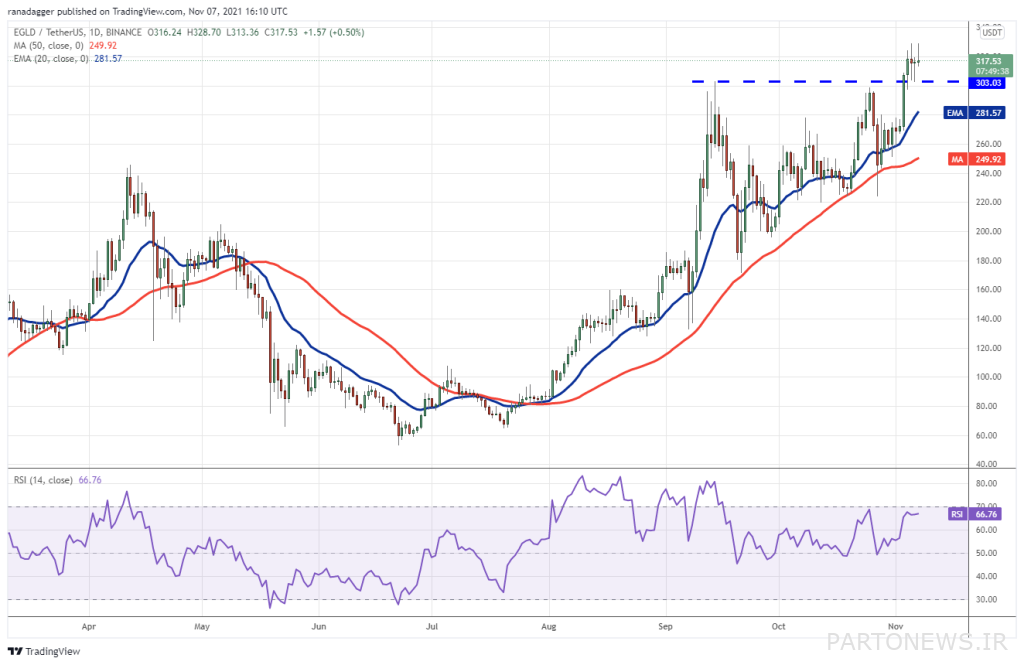
This shows that buyers are trying to defend this level and turn it into support. Crossing the $ 329 level and closing the daily candle above this level could be a sign that the uptrend will continue. The uptrend of the 20-day moving average at $ 281 and the relative strength of the near-saturation indicator indicate that the price is resisting slightly on its uptrend.
On the other hand, if Elrond continues to fall below current levels below the $ 303.03 breakout level, the next stop could be the 20-day moving average. A strong price return from this level of credit will keep the current uptrend, but breaking it could pave the way for a deeper correction to the simple 50-day moving average at $ 249.
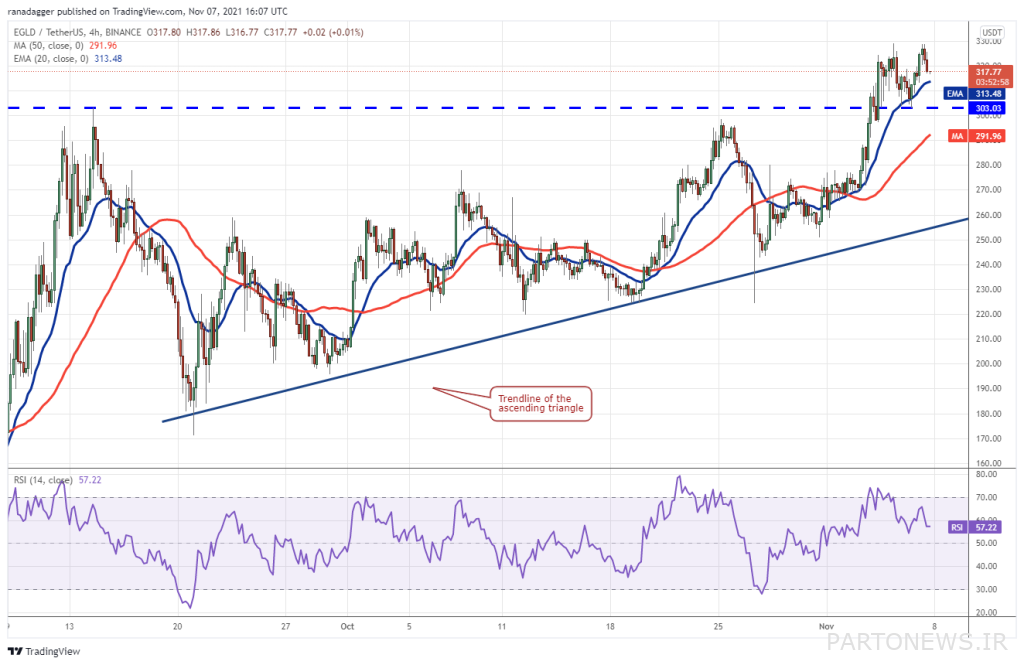
In the 4-hour view of the market, a bullish triangle pattern can be seen, the formation of which has been completed by crossing the price of $ 303.03. The target for this uptrend is $ 427, but since sellers are likely to be active at the $ 335 level, the price movement may not be straightforward.
Breaking the moving average of 20 candlesticks will be the first sign of buyers’ weakness. This could push the price to the breaking level of the uptrend pattern at $ 303.03, in which case supporting this level would be important for buyers. If the $ 303.03 support is broken, the price may continue to fall to the simple moving average of 50 candlesticks and then the uptrend triangle.

