What is a logarithmic price chart and how is it different from a regular chart?
If you are new, you have probably just used arithmetic charts to check the price; But there are other types of price charts called logarithmic charts and depending on the situation, they can give you a better view of price trends and price fluctuations. Many users and even analysts think that using a logarithmic chart or arithmetic (linear) chart is not important; But this seemingly typical parameter can significantly affect our understanding of the market.
Interpretation of price charts can vary depending on the type of scale used when reviewing the data. Most charting software or programs written by brokerages provide the user with different types of charts. In general, the two most common types of scales used to analyze price fluctuations are the Logarithmic Scale and the Linear Scale.
Before defining these two parameters, we should point out that in the articles that refer to the study of logarithmic or arithmetic scale concepts, often referred to as Logarithmic diagram Used to be a common mistake in our translation and writing. Since this phrase is neither mathematically nor correctly translated, it is better to use the term logarithmic scale instead of logarithmic diagram.
- The linear price scale, also called the arithmetic scale, shows the equal distance between prices. Arithmetic scales are commonly used by default in many softwares.
- The logarithmic scale of a price, also called a log in charts, depends on the percentage change in the price of the underlying asset, and is often used by professional analysts.
Using the contents of websites Warrior Trading And Inostopedia, We will examine the differences and features of the logarithmic and arithmetic scales.
What is an arithmetic or line chart?
In general, by default, many of the price charts we see are drawn on a linear or arithmetic scale. Using arithmetic scale in the chart can be considered as one of the most common methods in technical analysis.
In this scale, price movement is displayed with a percentage change It is not possible Rather, price levels are plotted on a fixed basis. Each change in values is displayed on a graph, so it is easier to draw a graph with an arithmetic scale manually.
The arithmetic scale is drawn on the Y axis or the vertical axis, and there are equal distances between the values. Simply put, on a vertical axis arithmetic scale that represents prices, it is divided into equal intervals; This means that the distance between each interval is the same as the other interval.
As you can see in the image below, on an arithmetic scale, the change in the price of Bitcoin from $ 20,000 to $ 30,000 is shown in the same way that the change in price is from $ 50,000 to $ 60,000. In the first case, the value of an asset has increased by 50%, while in the second case, we have only a 20% increase in price. This significant difference can create problems for the analysis of assets whose price multiplies.
Therefore, it can be said that the arithmetic chart shows the changes when the price decreases, less than it really is, and when the price goes up, it shows the changes to the user too high and unusual.
What is a logarithmic diagram (scale) and how is it different from an arithmetic diagram?
In a logarithmic diagram, instead of the prices themselves being equidistant from each other (as in the arithmetic diagram), The same changes in the percentage of prices, Are placed at equal distances from each other.

Most technical analysts and traders use logarithmic charts. Percentage changes, which are usually repeated, are shown as equal distances between numbers. On the logarithmic scale, for example, the distance between the numbers $ 10 and $ 20 is equal to the distance between $ 20 and $ 40, because in both cases there is a 100% increase in price.
On a logarithmic scale, the change in price from $ 20,000 to $ 30,000 varies greatly from $ 50,000 to $ 60,000 on an arithmetic scale. Although both of these dollar price increases are the same, the first $ 10,000 increase represents a 50% return, and the second increase represents a 25% return on asset prices.
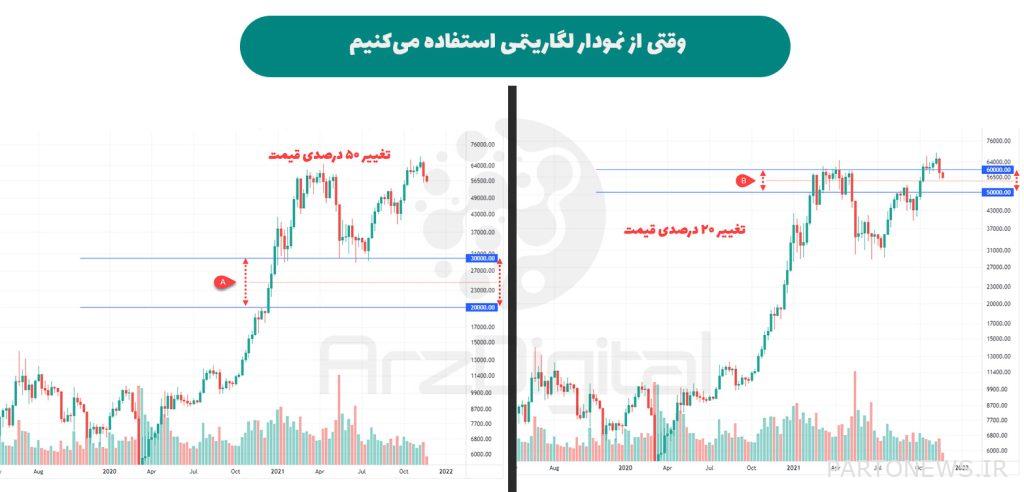
Because a 50 percent jump is significantly different from a 25 percent jump, Chartists or technical analysts use logarithmic graphs to show this difference; Because at this scale, the percentage of mutations will be more well visible. In doing so, they use larger distances and scientific notation to display the Orders of Magnitude.
It should be noted that if the prices are close to each other, the use of the logarithmic scale may seem a bit crowded and illegible.
The difference between arithmetic and logarithmic scales is important when looking at charts, but there are other types of technical analysis that you can use to identify price trends.
A logarithmic scale is more appropriate when the fluctuations are severe and the trader wants to monitor the market with a long-term view. On the other hand, traders who trade on a daily and short-term basis and seek to analyze prices at short intervals, an arithmetic scale will be a better option for them.
In short- to medium-term charts with low fluctuations, the type of scale used is not very important, and if we change the scale of the chart from arithmetic to logarithm, we do not see a significant difference.
Of course, it can also be pointed out that according to the price display in arithmetic and logarithmic scales, arithmetic scales provide absolute values to the trader, while the logarithmic scale expresses relative amounts of change.
How to set the graph to a logarithm?
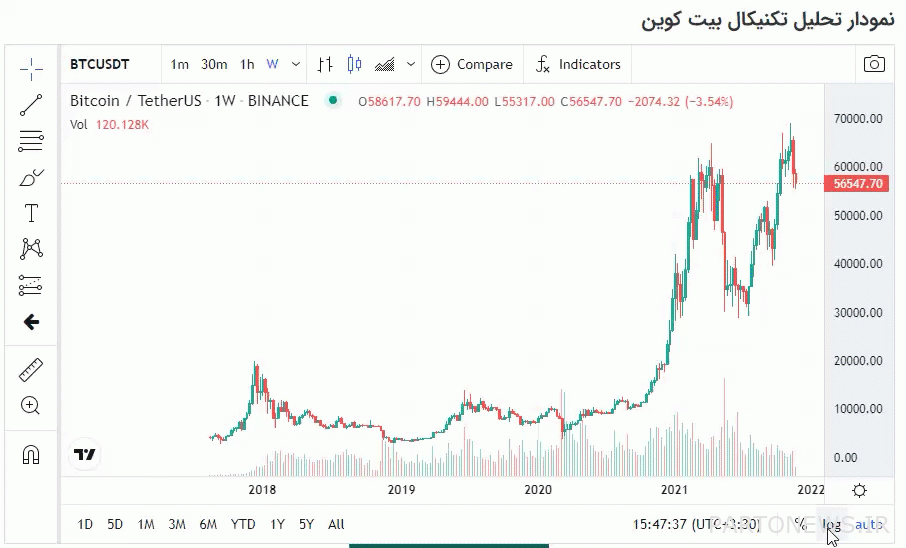
In most price charts, the scale of the chart can be changed logarithmically with one click. For example, in Trading View, just click on the “log” option at the bottom right to activate the logarithmic mode.
When to use a logarithmic diagram?
Although each of the logarithmic and arithmetic scales has its own uses and characteristics, the logarithmic scale shows a sharp increase or decrease in price compared to the arithmetic scale. These scales in the chart can help a lot in visualizing the price movement and achieving the desired goals for buying or selling.
Given the differences we have made between arithmetic and logarithmic scales, the question arises as to whether to use the arithmetic scale or logarithmic?
In response, it should be said that the arithmetic scale, unlike the logarithmic scale, can not determine the degree of profitability at different prices, so in the context of the logarithmic scale, one can see the real trend of prices, and therefore most professional analysts use this type of scale. So it is better to use a logarithmic scale to compare a price chart with the reality of the market.
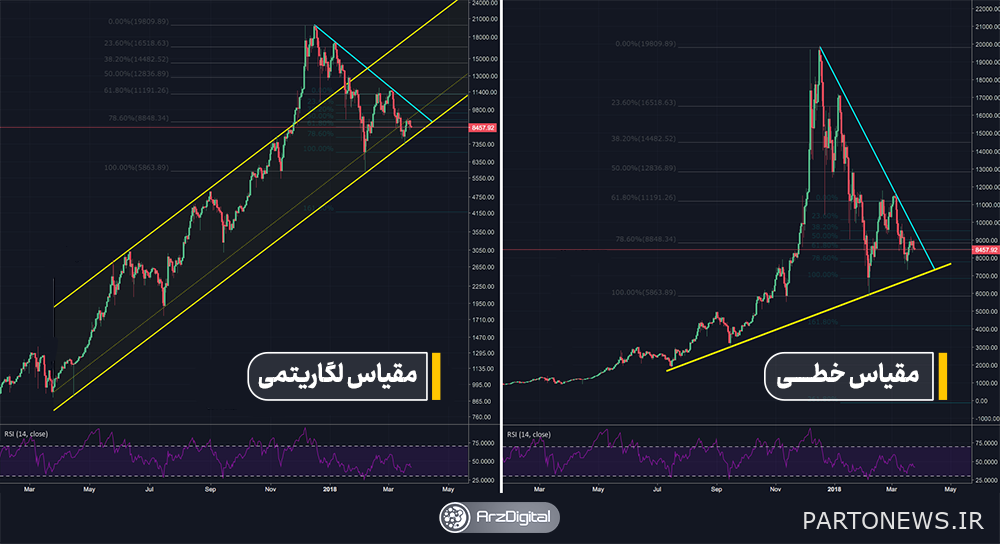
Since the logarithmic scale in terms of price percentage changes enables the user to have a better forecast of the market, so when we want to adjust our trades with a long-term view, we must go to the logarithmic scale.
Using a logarithmic scale in markets that are trending and often accompanied by large changes gives the analyst a better view. Instead, if we use the logarithmic scale in graphs with almost constant and small-scale trends, we will not see a significant difference with graphs with arithmetic scale.
Finally, it should be noted that there are successful traders who have only been able to achieve accurate analysis using the arithmetic scale, so it is not bad to look at the arithmetic scale while analyzing the price of an asset; Because it is possible to observe technical points that we have not paid attention to in the logarithmic state.
Finally, examining different approaches and methods and adapting it to your trading style and choosing the best parameter is a more logical idea.
Conclusion
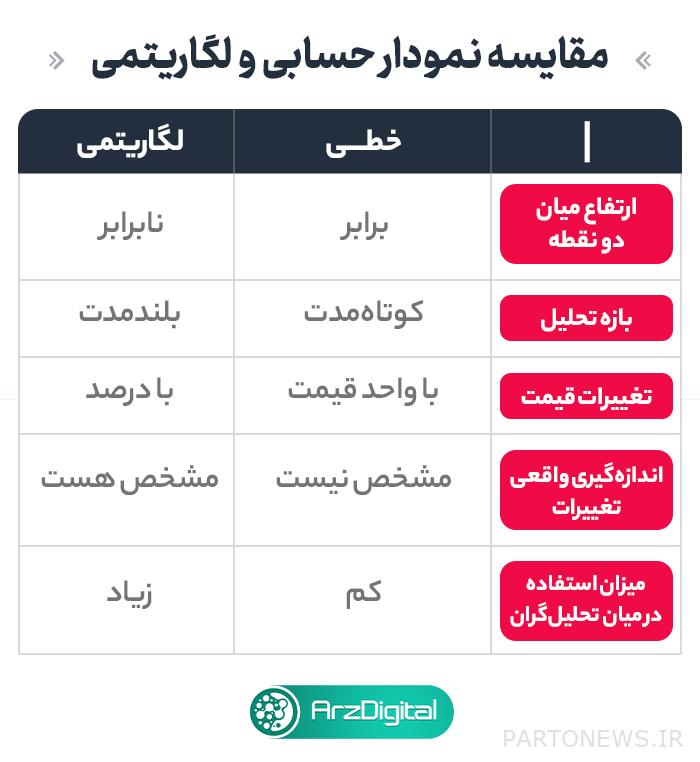
To see the price in the price charts, we have two options. Either we can use the arithmetic (linear) scale or we can use the logarithmic scale. On an arithmetic scale, the distance between different price levels is the same. However, if the graph is logarithmic, the distances change on a percentage basis.
It should not be forgotten that the use of these charts may change depending on the situation, and you can choose one of them depending on your needs; For example, as mentioned earlier, line graphs are used for price stabilization intervals and logarithmic graphs are used for periods where asset prices are more volatile.

