Bitcoin and Dodge Coins jump after selling Twitter to Ilan Mask; Will the upward trend continue?

With the completion of Twitter sales to Ilan Mask, Bitcoin and Dodge Coin have jumped in price over the past 24 hours, and many analysts have already spoken of their outlook for the market. There are many reasons for the uptrend in the overall digital currency market.
To Report Kevin Telegraph, the digital currency market, faced selling pressure early on April 25; But after it became clear that Ilan Mask had finalized his $ 44 billion purchase of Twitter, we saw signs of rising prices in the market.
Following the price of Bitcoin falling to $ 38,210 early on Monday, with the news of Twitter sales in the media, the digital currency jumped 5.72% to its highest level in several days, about $ 40,800. Receipt.
In the following, we will examine the status of intra-chain data and analysts’ views on the future of prices.
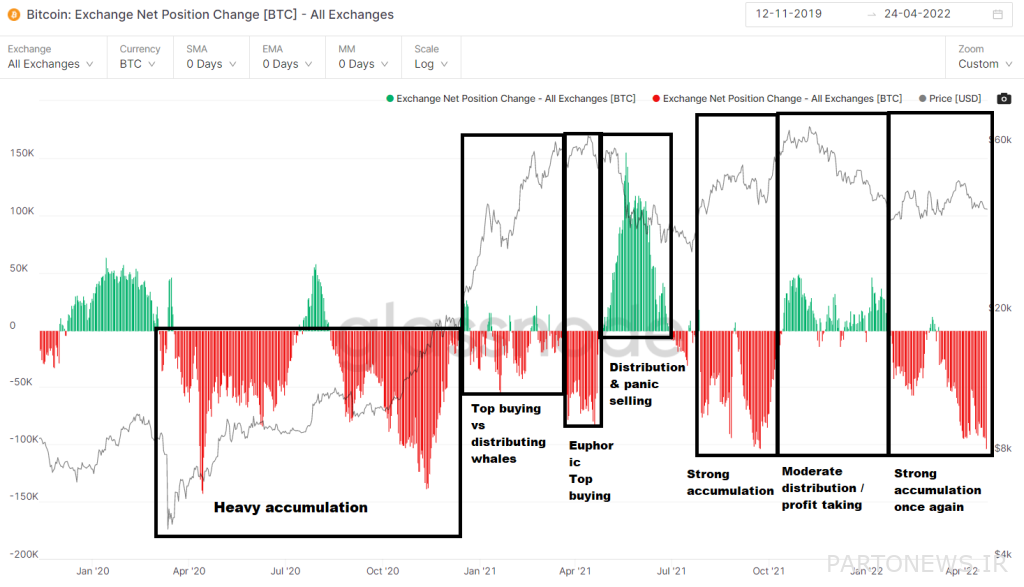
The decline in exchange reserves indicates a sharp accumulation
A digital currency trader named Phoenix has taken to Twitter to talk about the dominance of recent declining sentiment in the digital currency market. By publishing the following chart, he announced the decrease of bitcoin reserves in exchange offices, which shows a strong accumulation among investors.

Phoenix has said:
Why do you think we are in a bitcoin distribution situation right now? These simple graphs show that the accumulation process has been going on for months. What you may not have and need is patience.
Bitcoin is still bullish on previous price levels
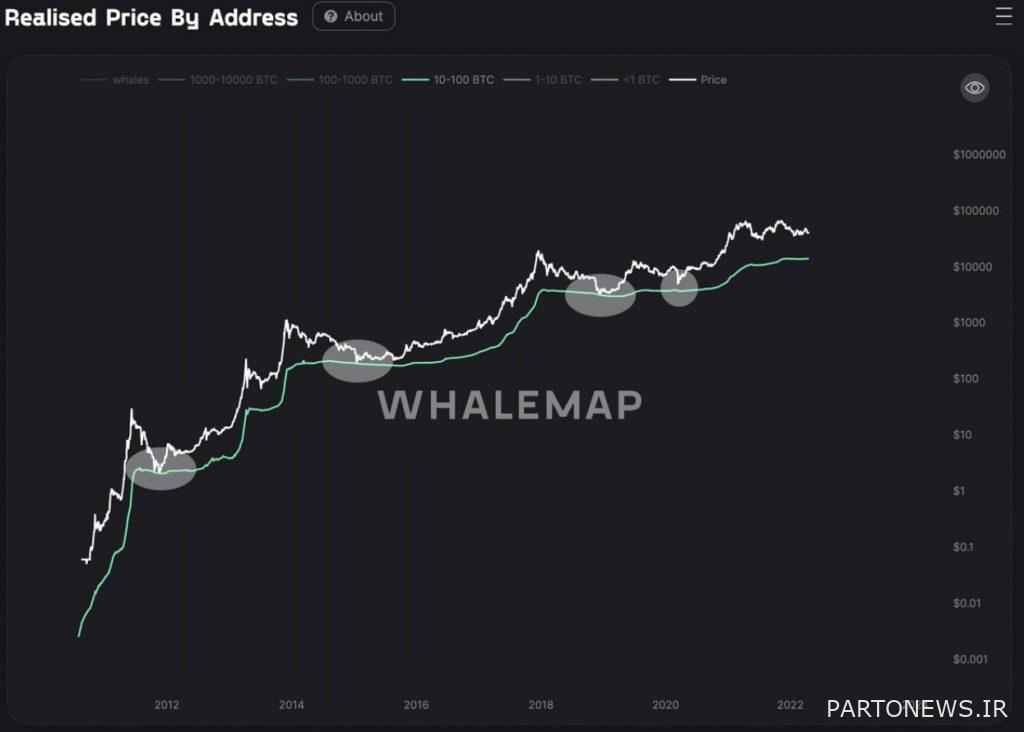
While the recent price correction is not yet complete, the support level that shows the bitcoin price floor throughout history remains unchanged, according to Whalemap. As can be seen from the chart below, buying bitcoins when dealing with this level of support has generated very good returns for investors in the future.

As the chart above shows, the current price of Bitcoin is much higher than the support line that marks the end of each macro cycle. This diagram can be interpreted in several different ways; Either the downtrend in the market is not over yet, or the uptrend in bitcoin continues. Investors, on the other hand, may perceive that if the current lack of strength in the uptrend is accompanied by a fall below $ 20,000, the digital currency market will be hit hard.
Will the upward trend continue?
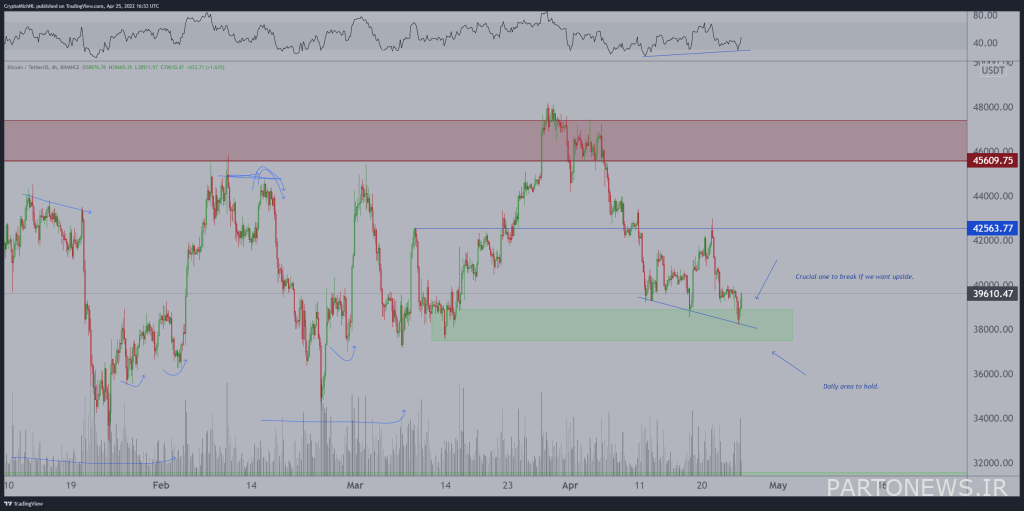
Leading digital currency analyst Michaël van de Poppe has outlined his vision for the future of bitcoin by publishing the chart below. Van Depop believes the $ 39,610 level is a vital level to overcome the sell-off and continue the uptrend.

“Depop has said:
There is a strong uptrend in the bitcoin trend that may jump from current prices to higher levels in the long run. I think Bitcoin is ready to continue the uptrend.
The total market value of digital currencies now stands at $ 1.836 trillion, and the bitcoin dominance rate is 42.02%.

